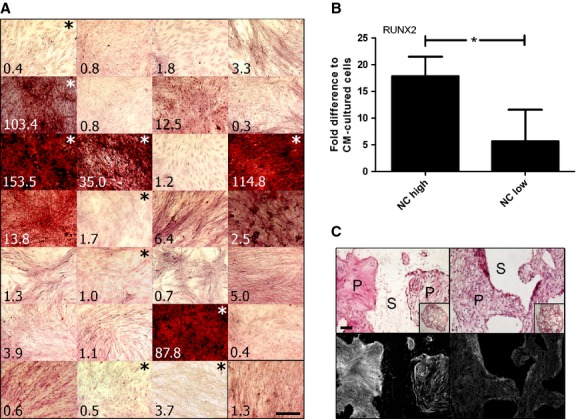
Figure 3.

Clonal populations representing elevated intradonor heterogeneity and osteogenic capacity within a whole NC population. (A) Alizarin red staining of matrix obtained after 2 weeks osteogenic induction of all the individual clones from total population of NC. Numbers in bottom left of each image refer to total calcium (μg Ca/μg DNA) associated with a duplicate well. Lower right black-boxed image represents whole NC population. (B) qPCR of RUNX2 expression in NC clonal populations following osteogenic stimulation; n = 4. (C) Representative haematoxylin and eosin (upper row) and red filter florescence imaging of haematoxylin and eosin stained tissues to show relative collagen fibril densities (lower row) of explanted clones; Left column = NC high; right column = NC low. NC high = clones with intense alizarin red staining (indicated with white asterisk); NC low = clones with little to no alizarin red staining (indicated with black asterisk). S = decalcified scaffold (no cells present), P = pores of the scaffold (presence of cells and tissue development); scale bars = 100 μm.
