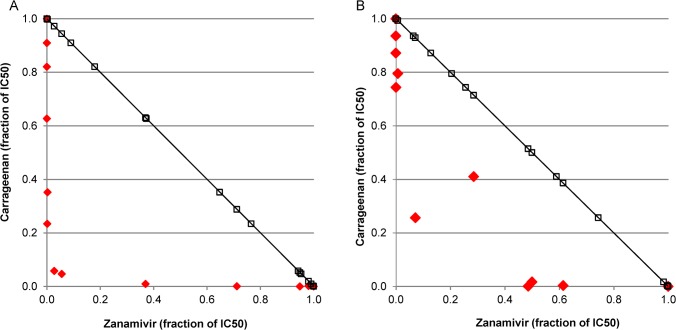
Fig 1. Isobologram of compound interaction.
Comparison of the combination of different doses of both compounds necessary to reach 50% replication inhibition of (A) H7N7 and (B) H1N1(09)pdm (◆) to a model of dose additivity that would represent a curve progression of 1 (□). Dose response was tested with an adapted plaque reduction assay with semi-liquid overlay in MDCK cells. On the x-axis the concentration of Zanamivir and on the y-axis the concentration of carrageenan is presented. The concentrations (determined as mean of 3 replicates) are given as the fraction of the respective IC50 values of the different viruses with the particular compound (IC50 = 1).

