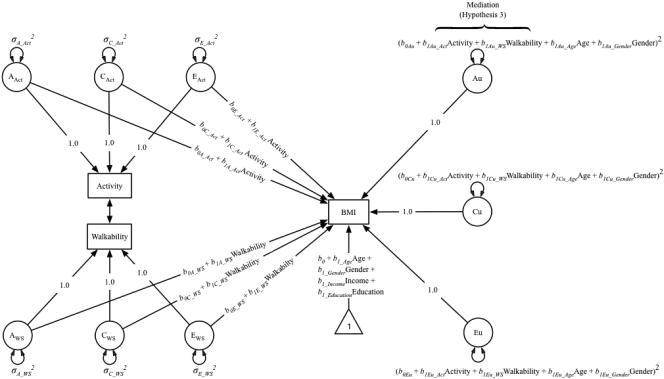
Figure 2.
Path diagram of G×E interaction in the presence of rGE, with moderation of variance in BMI by both environmental walkability and moderate-to-vigorous physical activity (MVPA). This model is an extension of the model illustrated in Figure 1. The residual variances Au, Cu, and Eu vary as a function of walkability, MVPA, and covariates age, and gender; these paths test Hypothesis 3. Only one twin is shown for clarity; the A and C components of the phenotypes correlate across twins (rA = 1.0 for monozygotic twins, 0.5 for dizygotic twins; rC = 1.0 for all pair types); the E components are not correlated across twins. Individual-level covariates income and education correlated across twins.

