
Fig. 8.
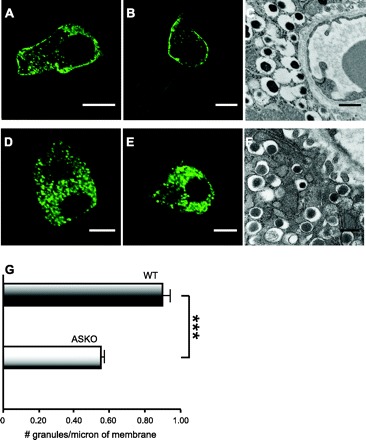
Differences in density of surface insulin granules between ASKO and WT islets. Islets from ASKO and WT mice were isolated and cultured in 5.5 mM glucose for 24 h in parallel. A: Ins-C-emGFP expressed in WT islet β-cell 1. B: Ins-C-emGFP expressed in WT islet β-cell 2. C: ultrastructure of WT pancreatic β-cell showing organized clustering of insulin-secretory granules along surface membrane. D: Ins-C-emGFP expressed in ASKO islet β-cell 1. E: Ins-C-emGFP expressed in ASKO islet β-cell 2. F: ultrastructure of ASKO pancreatic β-cell showing disorganized insulin-secretory granules away from surface membrane. G: In electron micrographs, perimeter membrane regions in β-cells were identified facing an islet capillary with red blood cells and compared between ASKO and controls (n = 4 islets each). Density of insulin granules along the surface membrane of β-cells from Ins-C-emGFP-expressing WT (A and B) and ASKO (D and E) islets. Densities were measured by counting the number of fluorescent insulin granules within 1.5 μm of the perimeter membrane of a central optical section, identified by the large oval nuclear region devoid of fluorescence. ×60, oil. *P < 0.05, ***P < 0.001. Scale bars in confocal fluorescent images are 5 μm and in EM images 500 nm.