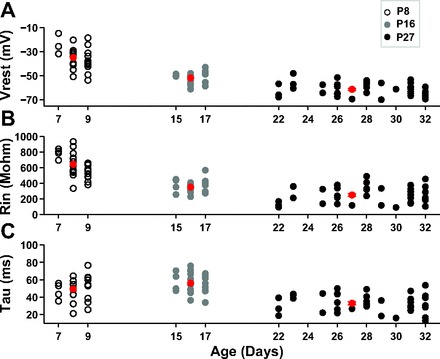
Fig. 1.

Development of membrane properties. A: resting membrane potential (Vrest; in mV) as a function of age. In A–C, the open circles show postnatal day (P)7–P9 neurons, gray circles show P15–P17 neurons, and filled circles show P22–32 neurons. Red symbols in A–C are means for each age group. B: input resistance (Rin; in MΩ) as a function of age. C: membrane time constant (τ; in ms) as a function of age.
