
Fig. 3.
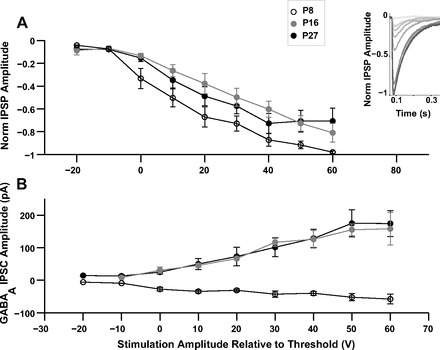
Amplitude of IC-medial geniculate body (MGB) inhibition. A: mean normalized IPSP amplitude at increasing stimulation amplitudes at P8 (open circles), P16 (gray circles), and P27 (filled circles). 0 V on the x-axis represents the threshold stimulation voltage. The inset shows normalized IPSPs at increasing stimulation amplitudes for a P8 cell where the peak IPSP amplitude was −13.6 mV. B: mean GABAA inhibitory postsynaptic current (IPSC) amplitude at P8 (open circles), P16 (gray circles), and P27 (filled circles) at increasing stimulation amplitudes. Clamp potential was −70 mV for cells at P8 and −50 mV for cells at P27 and P16.