
Fig. 4.
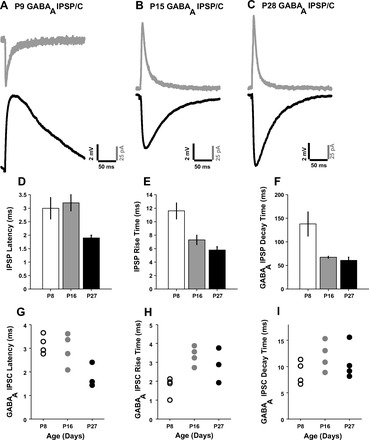
Temporal properties of IC-MGB inhibition to single shocks. GABAB and ionotropic glutamate receptors were blocked to isolate GABAA components. A: P9 neuron GABAA IPSC (gray trace, Vclamp = −70 mV) and GABAA IPSP [black trace, membrane potential (Vmem) = −72.4 mV]. B: P15 neuron GABAA IPSC (gray trace, Vclamp = −50 mV) and GABAA IPSP (black trace). C: P28 neuron GABAA IPSC (gray trace, Vclamp = −50 mV) and GABAA IPSP (black trace). In D–F, open bars indicate P8, gray bars indicate P16, and filled bars indicate P27. Error bars are SEs. D: mean IPSP latency at the ages shown. E: mean IPSP rise time. F: mean GABAA IPSP decay time. In G–I, each symbol represents a measurement from an individual neuron. G: GABAA IPSC latency. H: GABAA IPSC rise time. I: GABAA IPSC decay time.