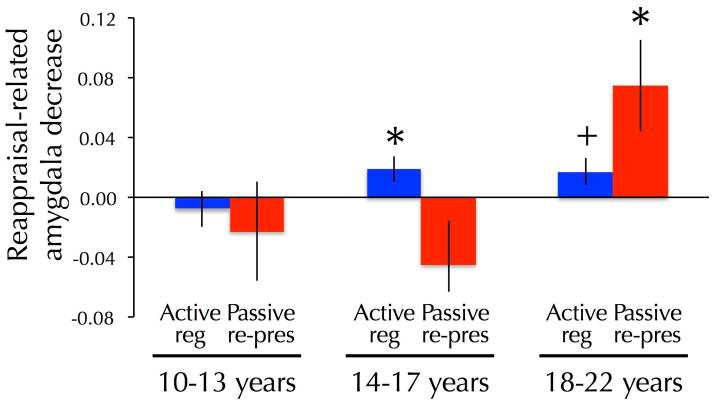
Figure 3.
Bar graphs lines depicting magnitude of left amygdala decrease (Reactivity/negative > Regulation/negative) as a function of age and task phase (Reg=active regulation task, Rep=passive re-presentation task). Analyses were conducted using a continuous measure of age but age is shown categorically to facilitate interpretation. Paired, two-tailed t-tests were performed to compare the reactivity and regulation conditions within each age group to further facilitate interpretation (*p<.05; +p<.08).

