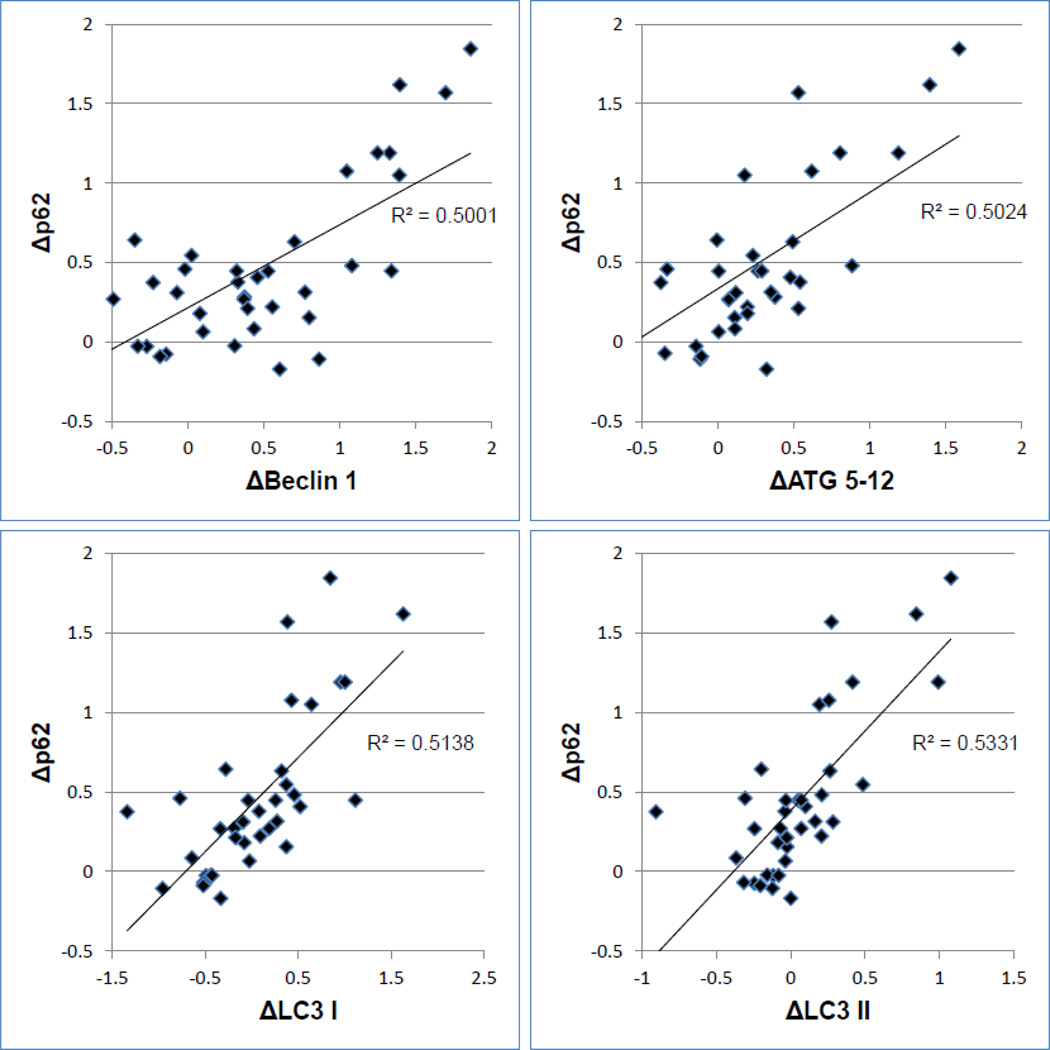
Figure 3. Correlations between p62 and other markers of autophagy.
The delta value refers to the difference in abundance (detected by western blotting) from beginning of aortic cross-clamp to end. All values normalized to actin levels. A larger delta value reflects greater autophagic flux. P<0.0001 for all correlations.

