
Fig. 7.
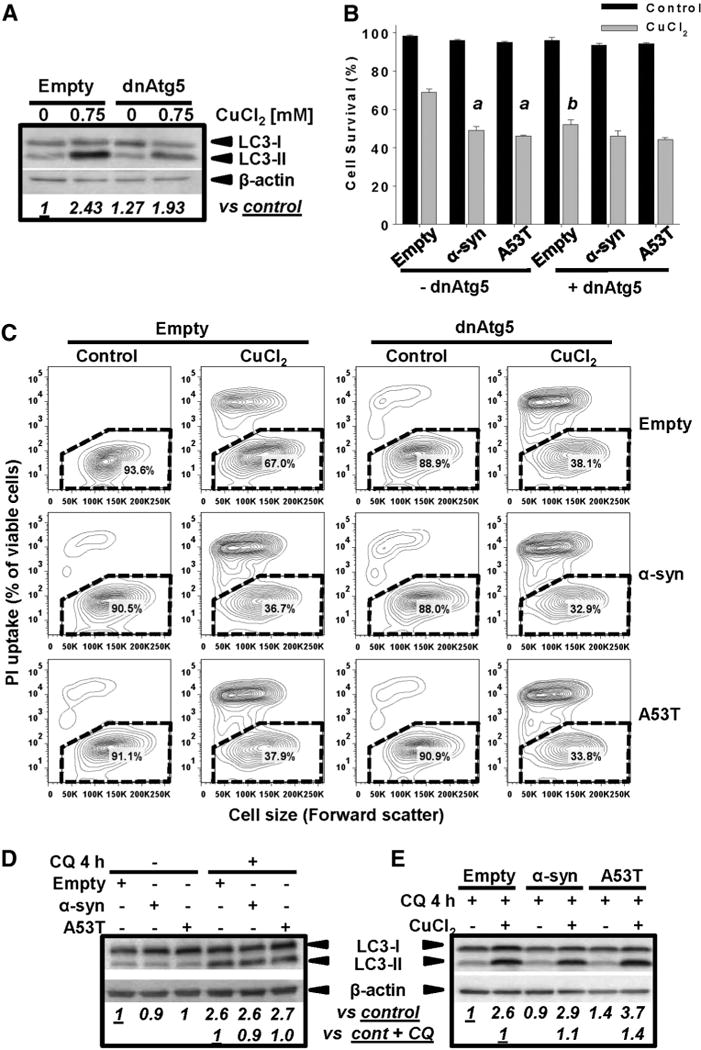
Inhibition of Atg5-dependent autophagy increases Cu toxicity but not the synergistic toxicity of Cu/α-synuclein. Cells were transduced with Ad-dnAtg5 (1.5 MOI) and/or Ad-α-synuclein or Ad-A53T (3 MOI) for 24 h. Ad-Empty was used as control at the MOI required to normalized the MOI used for other treatments (4.5 MOI total), In A, D and E, autophagy (LC3-II accumulation) induced by 0.75 mM CuCl2 (48 h) was evaluated by WB. In D–E, autophagy flux was determined by incubation with CQ (40 μM) 4 h prior to sample isolation. Controls contained DMSO usedas vehicle for CQ. Numbersin WBs (italics) represent the densitometry analysis normalizedto β-actin with respect to controls± CQ. In C, cell death induced by 0.75 mM CuCl2 (48 h) is represented in two-dimensional 5% probability contour plots of PI fluorescence vs cell size (forward scatter) to depict cells with both compromised plasma membrane integrity (PI uptake) and decreased cell size. %s in the contour plots represent the population of viable cells (PI- and normal cell size, broken line regions). B: Two-way ANOVA, Holm-Sidak post hoc test was performed only on CuCl2 data, ap < 0.05 vs Empty + CuCl2; (with or without dnAtg5 transduction); bp < 0.05 vs -dnAtg5 within the corresponding virus category (empty, α-synuclein or A53T).