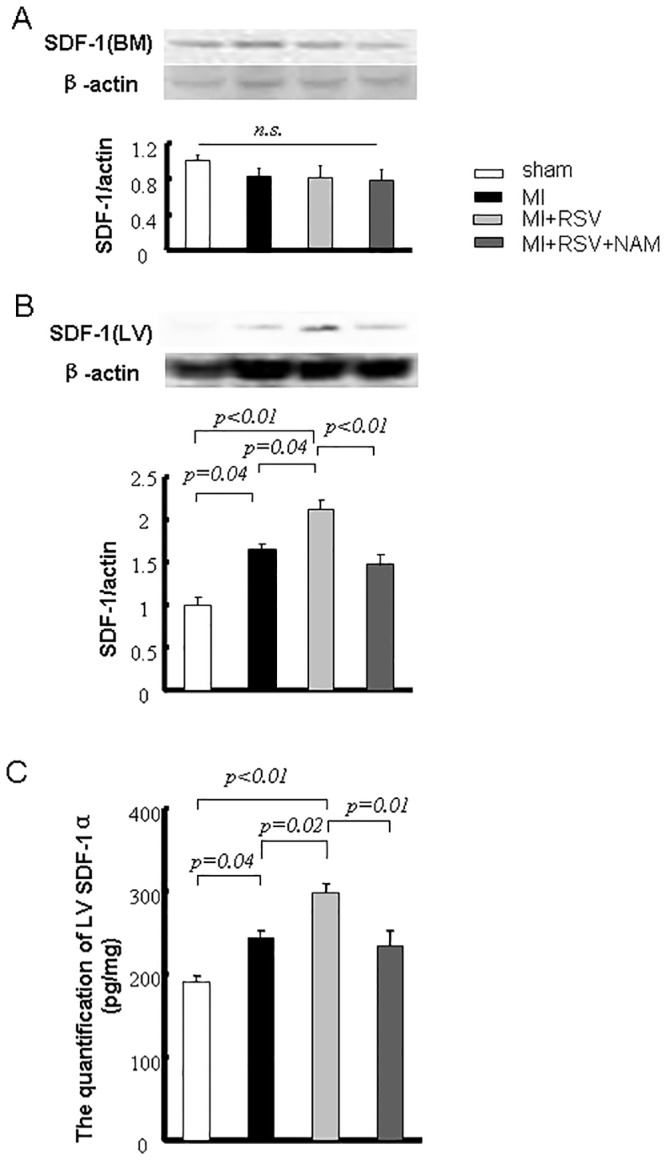
Fig 4. SDF-1 evaluation in the BM and LV.

Immunoblots of SDF-1 in BM. B. Immunoblots of SDF-1 in LV. The bar graph shows the quantification of the bands. C. Quantification of LV (infarct and peri-infarct areas) SDF-1α by ELISA.

Immunoblots of SDF-1 in BM. B. Immunoblots of SDF-1 in LV. The bar graph shows the quantification of the bands. C. Quantification of LV (infarct and peri-infarct areas) SDF-1α by ELISA.