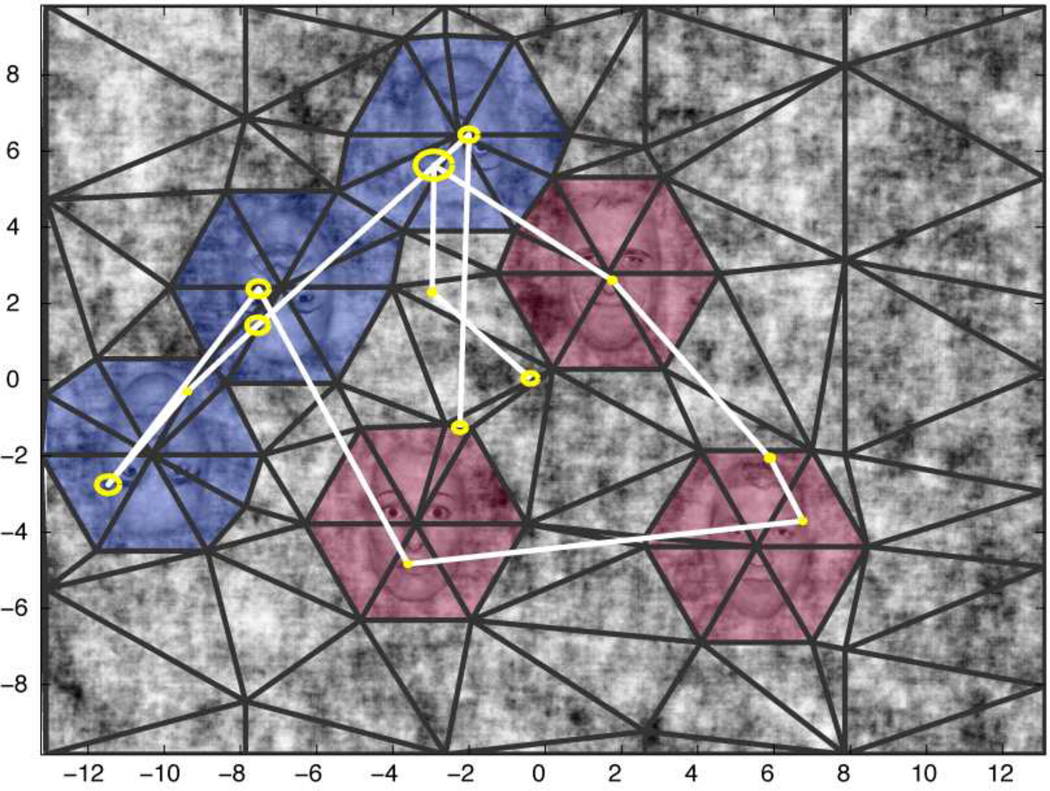
Figure 3.
Example of the binning and scanpath for a single trial. Fixations over the course of the trial are binned within outlined simplexes. A sample scanpath is shown by the white line with relative fixation duration indicated by yellow circles. Colors indicate the value of the regressor, Target, for each bin: .5 is red, −.5 is blue, and 0 is unshaded. Numbers show screen coordinates in degrees of visual arc.

