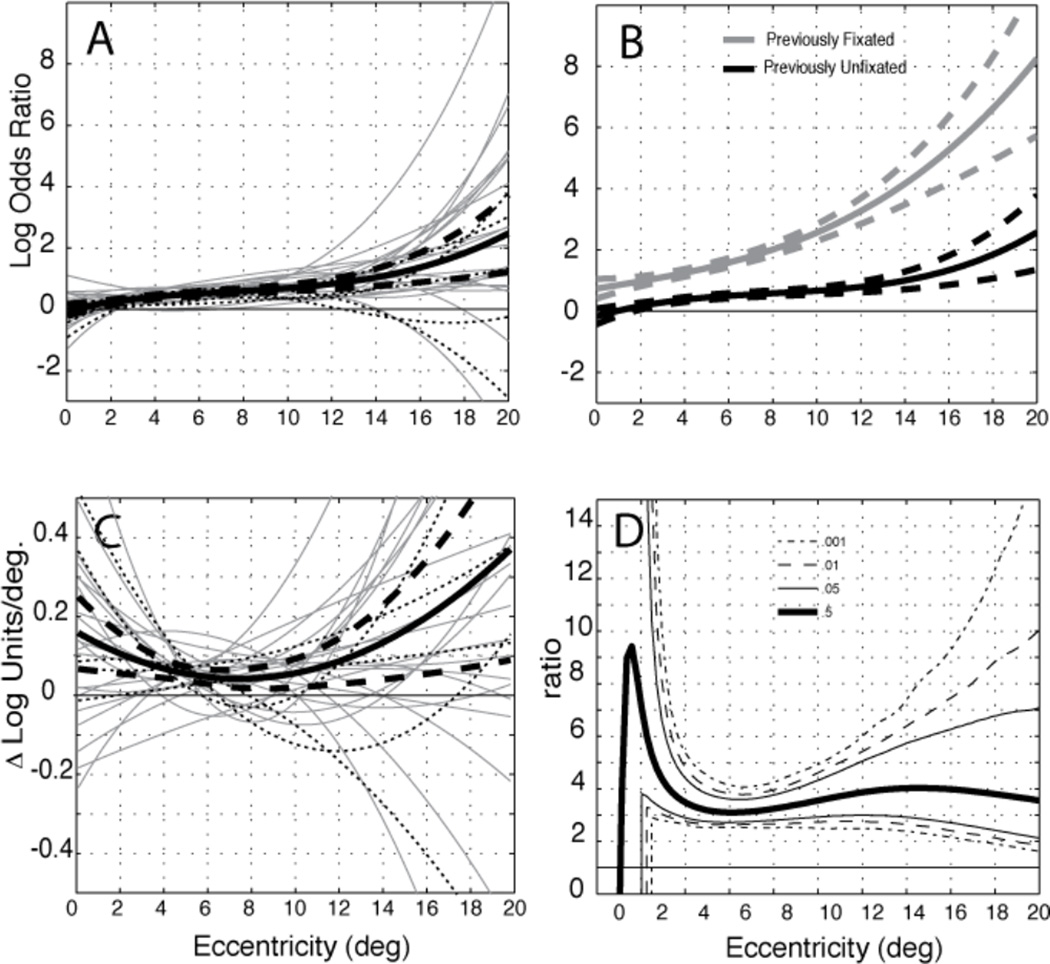
Figure 5.
Effect of task relevance with respect to eccentricity. A. Individual fits for experiment 1 (gray) and experiment 2 (dotted line) and group averages ±2 SEM (black) for previously unfixated faces. B. Group average and ±2 SEM for previously unfixated faces (black) in comparison to fixated faces (gray). C. Individually fitted curves and group average ±2 SEM for the slope of the task-relevance effect (as shown in panel A) with respect to eccentricity. D. Ratio of the task-relevance effect for return and initial fixations in the group averages (as shown in B); lines represent quantiles of a bootstrapped distribution for the ratio computed on group means, using 10,000 boostrap samples.

