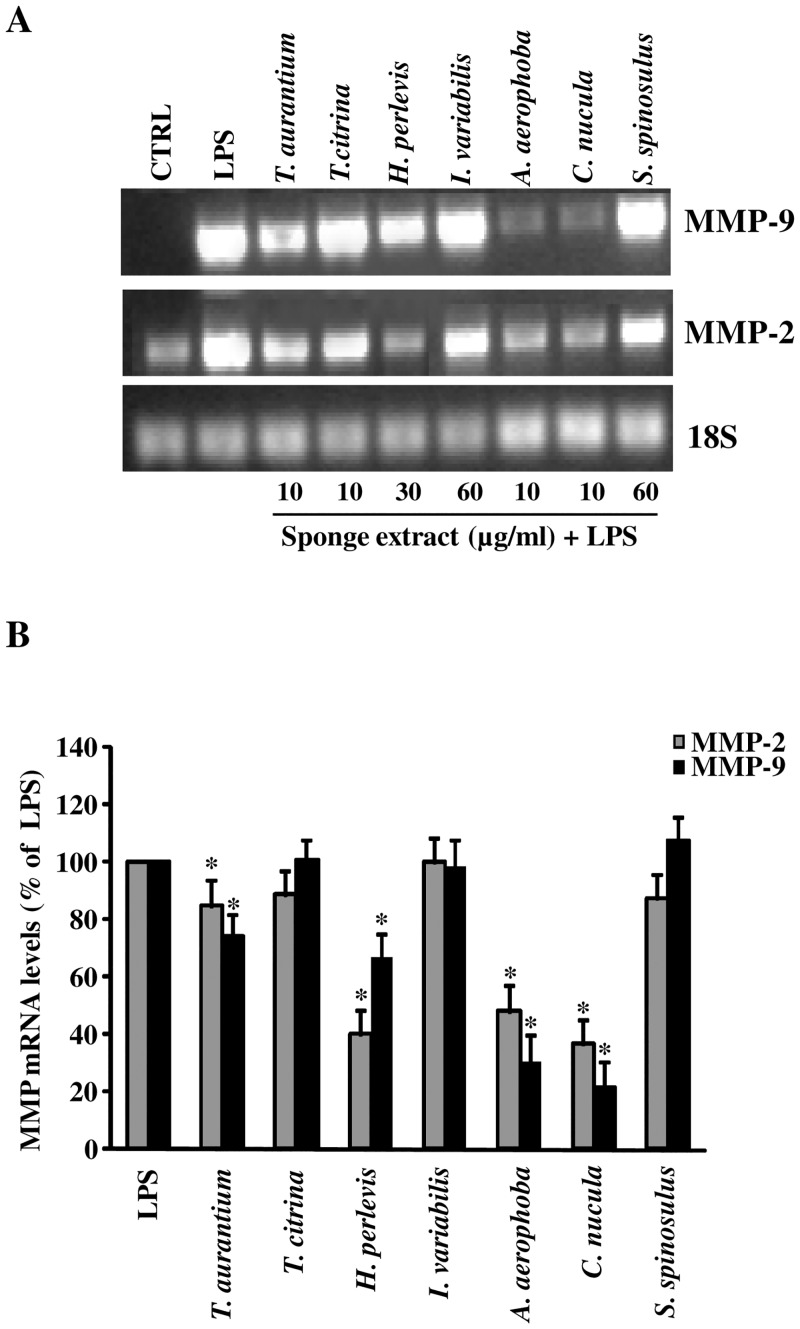
Fig 5. Effect of treatment with the different sponge extracts on MMP-2 and MMP-9 mRNA expression in astrocytes.
Primary astrocytes (1×10⁵ cells/ml) were activated with LPS (10 μg/ml) (positive control) and treated with each aqueous extract at the indicated concentrations. Untreated and unstimulated cells represent negative control (CTRL). After 24 h of incubation at 37°C, 5% CO2, total RNA was isolated from cells and RNA samples were analyzed by RT-PCR, using the primer pairs specific for MMP-2, MMP-9 and 18S. The products were run on a 1.5% agarose gel containing ethidium bromide. The bands were visualized under UV. Representative results are shown in A. Quantitation of the above experiment and two others after scanning densitometry are shown in B. Positive control MMP-2 and MMP-9 mRNA were set at 100%, and the treatments with the aqueous extracts represented as the percent of control (mean ±SD). Statistically significant inhibition of MMP mRNA expression in comparison to positive control (LPS) is indicated by asterisks (one way ANOVA followed by Tukey test; * = p<0.05).

