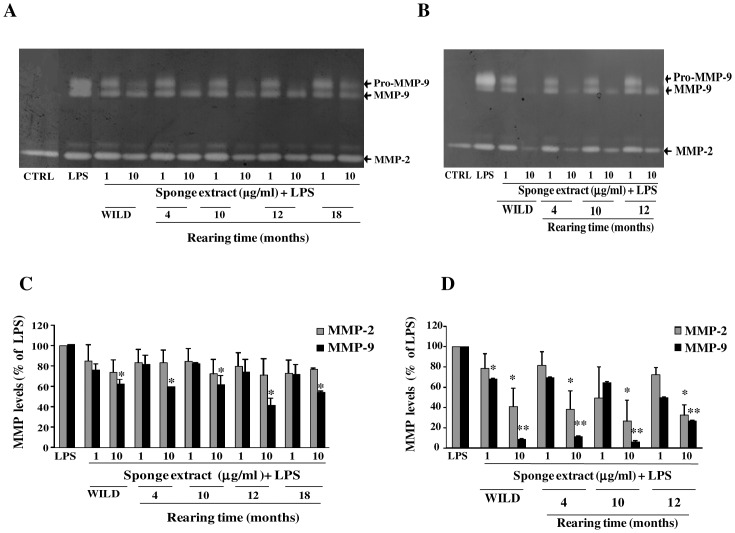
Fig 7. Inhibition of MMP-9 and MMP-2 levels by the sponge extracts from wild and reared specimens of T. aurantium and T. citrina.
Primary astrocytes (1×10⁵ cells/ml) were activated with LPS (10 μg/ml) and treated with the crude extracts from T. aurantium and T. citrina at the indicated concentrations. Untreated and unstimulated cells represent negative control (CTRL). Culture supernatants were harvested after 24 h of incubation and subjected to gelatin-zymography. Representative gels in A and B show the effect of the treatment with the crude extracts from wild and reared specimens of T. aurantium (A) and T. citrina (B) at the indicated rearing times. MMP-2 and MMP-9 were identified by their apparent molecular mass of 67 and 92 kDa, respectively, using pre-stained molecular weight markers (Bio Rad). Histograms in C and D represent results, expressed as mean ± SD, after scanning densitometry and computerized analysis of gels from at least three independent experiments with different cell populations. Asterisks represent values statistically different from LPS-treated astrocytes (positive control) (One-way Anova followed by Tukey test; * = p< 0.05; ** = p< 0.01).

