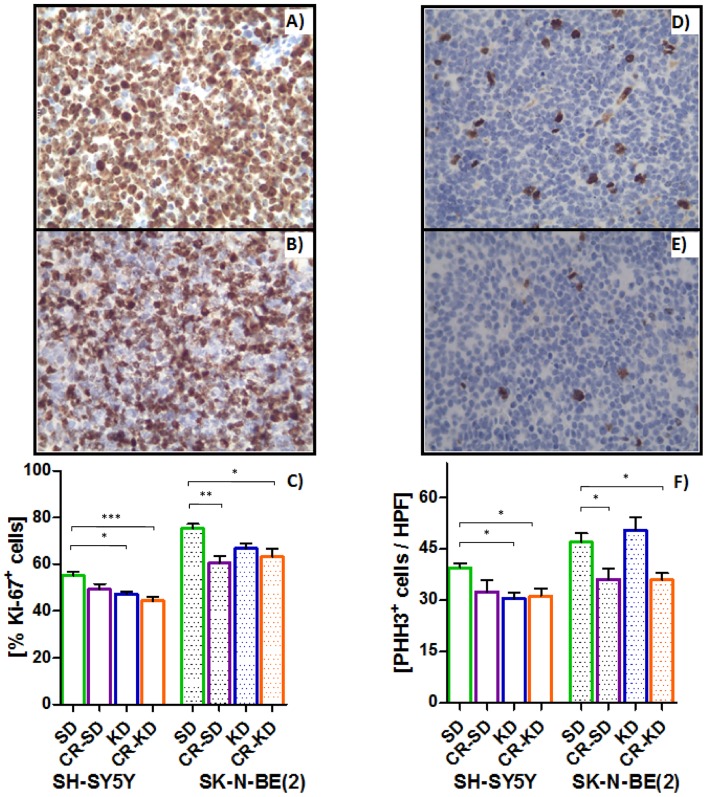
Fig 2. Proliferation indices Ki-67 (A-C) and PHH3 (D-F) suggest reduced proliferation by G0 or early G1 arrest.
CR reduces proliferation in both cell lines whereas KD caused no reduction of proliferative activity in the SK-N-BE(2) xenograft group. A) shows a representative SD Ki-67 staining pattern in comparison to the CR-KD pattern (B) in SK-N-BE(2) tumor samples. For SH-SY5Y xenografts, PHH3 staining is depicted in D) and E) for SD and CR-KD treatment, respectively. Results are given as mean ± SEM. Statistics: ANOVA (p <0.05) followed by Dunnett’s test correcting for multiple comparisons. Diet groups are compared to the corresponding SD. * p≤0.05; ** p≤0.01; *** p≤0.001.

