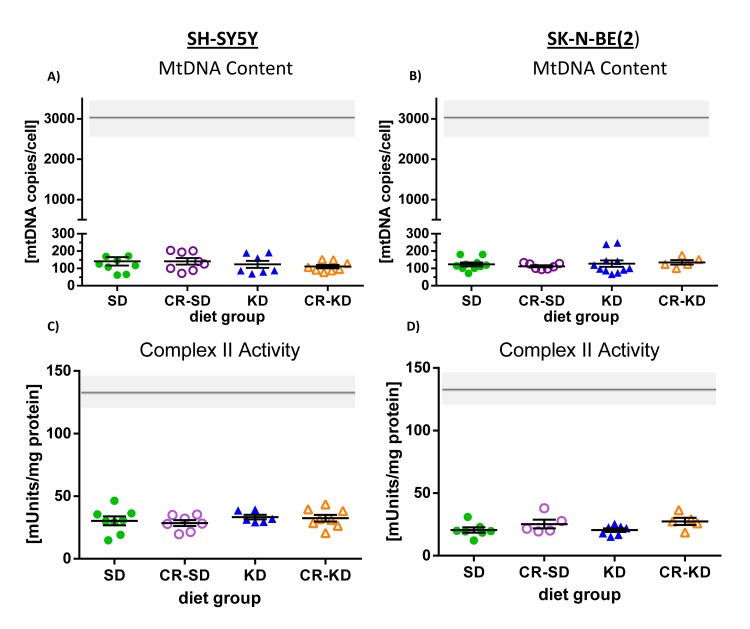
Fig 3. Evaluation of the adaptive response in mtDNA copy number and OXPHOS enzyme activities in NB xenografts to dietary intervention.
Both cell types SH-SY5Y A) and SK-N-BE(2) C) show consistent low copies of the mitochondrial genome (mean <150). Panels B) SH-SY5Y and D) SK-N-BE(2) show mean complex II (succinate dehydrogenase) enzyme activities in xenografts of the different diet groups. Enzyme activities of all individual OXPHOS complexes are additionally given in the S1 and S2 Figs. No significant differences were detected between the different diet groups. For the SK-N-BE(2) xenografts, only representative samples were measured (n≥5). Statistics: ANOVA (p <0.05) followed by two-tailed Dunnett’s test correcting for multiple comparisons. Diet groups are compared to the corresponding SD group. The gray bars represent control values from kidney cortex tissue as reported previously [3].

