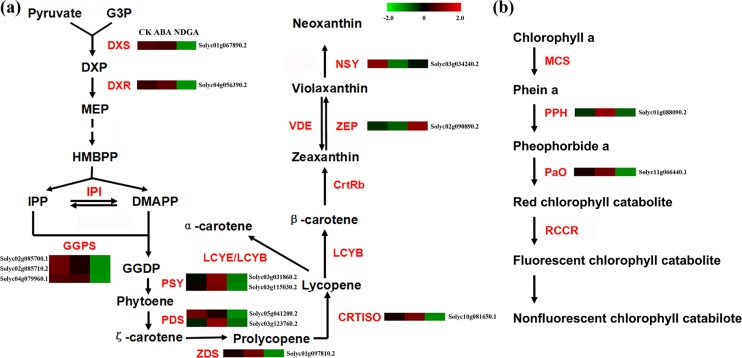
Fig 2. Analysis of DEGs involved in the pathway of carotenoid biosynthesis and chlorophyll degradation.
(a) Schematic diagram of carotenoid biosynthesis (modified from the reference [78]) and the expression profile of 13 DEGs encoding key enzymes in the pathway. (b) Schematic diagram of chlorophyll degradation pathway (referred to reference [78]). The expression profile of 2 DEGs encoding key enzymes in chlorophyll degradation. Analysis of the transcriptional profiles of the relative gene expression values (Z scores) was performed using the heatmap command, Red and green color represent up-regulated and down-regulated genes, respectively. Abbreviations are listed in Supplemental S19 Table.

