
Fig 5. Heatmap indicating the pattern of 128 significant differentially expressed transcripts at 0, 6 and 12 hpi time points.
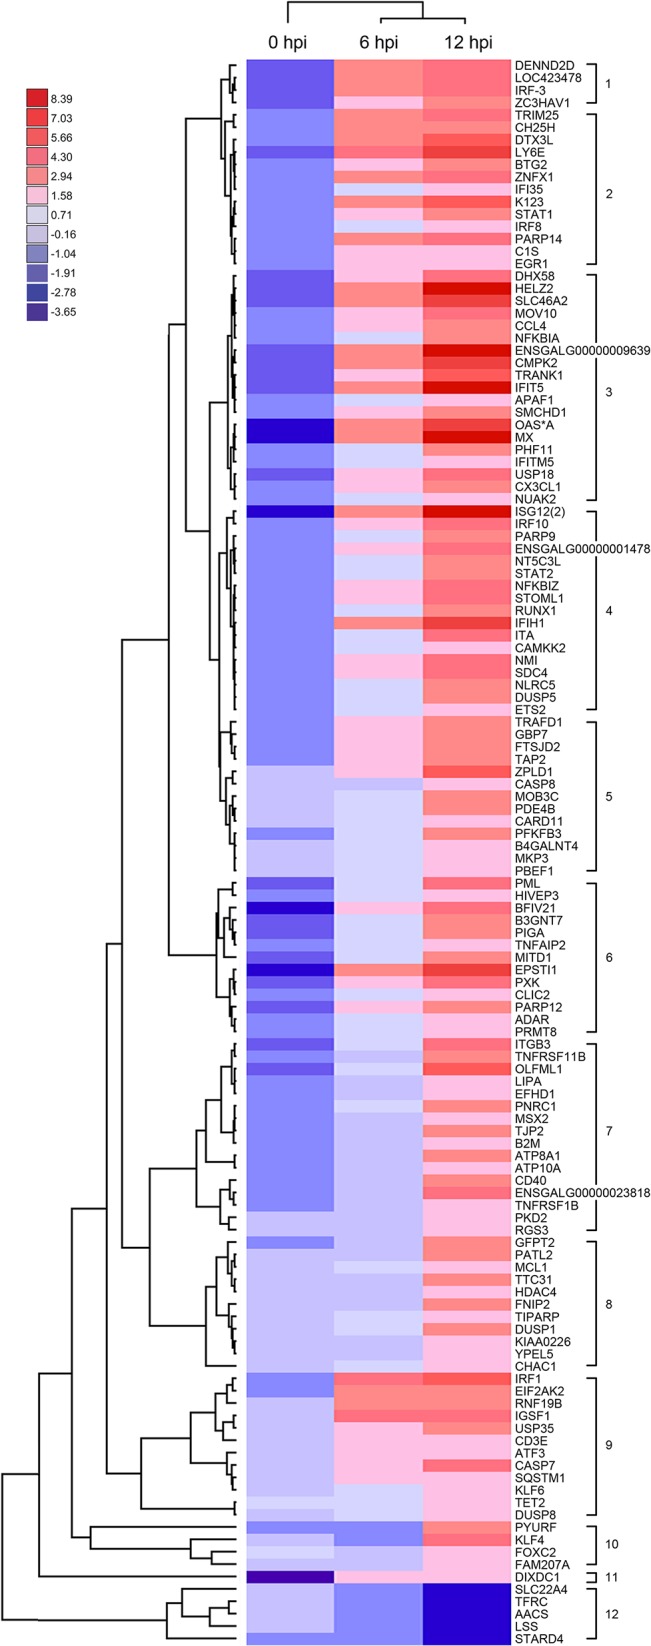
Expression fold change (log2 caIBDV/mock) are represented as indicated in the color scale. The transcripts were classified into 12 clusters according to their expression patterns.