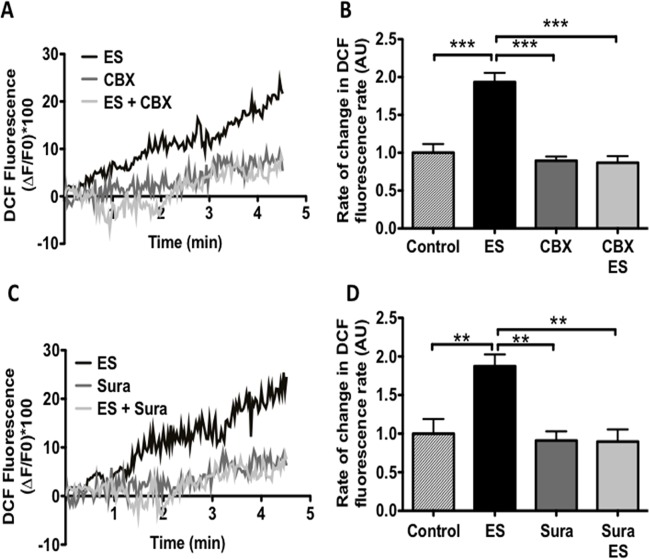
Fig 2. Electrical stimulation induced ROS production via ATP release and purinergic receptor.
Muscle fibers were isolated, load with DCF fluorescence (30 min) under control or stimulated, in the absence or presence of different inhibitors (30 min of incubation). A, representative traces of DCF fluorescence under control or stimulated, in absence or presence of CBX (10μM). B, slope of fluorescence from muscle cells stimulated with ES (see material and method), in the absence or presence of CBX. C, representative traces of DCF fluorescence under control or stimulated, in the absence or presence of suramin (10μM). D, slope of fluorescence from muscle cells stimulated with ES, in the absence or presence of suramin. (n = 6), **p<0.01, ***p<0.001.

