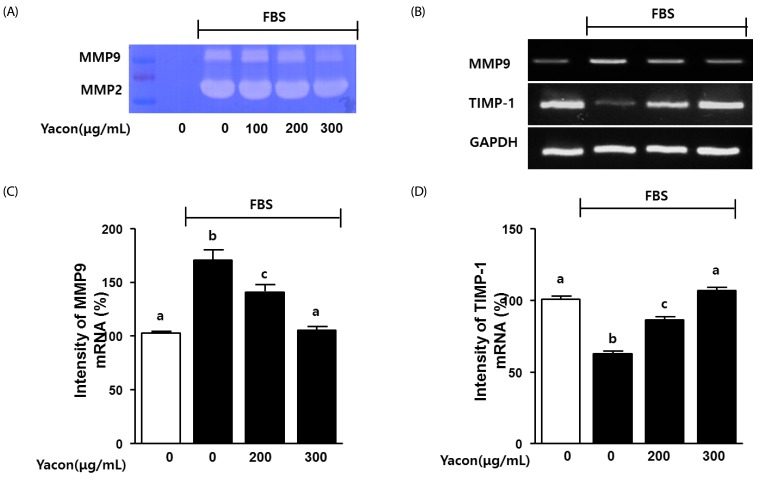
Fig. 5. The effect of yacon extract on MMPs and TIMP-1 activity in FBS-stimulated C6 glioma cells.
C6 glioma cells were seeded and then incubated in serum-free media for 24 h. (A) Cells were pre-treated with different concentrations of yacon for 1 h, and then treated with 10% FBS in addition to yacon for 24 h. Zymogarphy analysis were performed as described in material and methods session. (B) Cells were pre-treated with different concentrations of yacon for 1 h, and then treated with 10% FBS in addition to yacon for 6 h. Then, the RNA extraction and RT-PCR analysis were performed as described in material and methods session. (C,D) The graph represents the intensity of the bands relative to the untreated group. Results are presented as mean ± SE, and are represent 3 independent experiments. Values with the same superscript letter are not significantly different, as determined by Tukey's multiple range test (P < 0.05).

