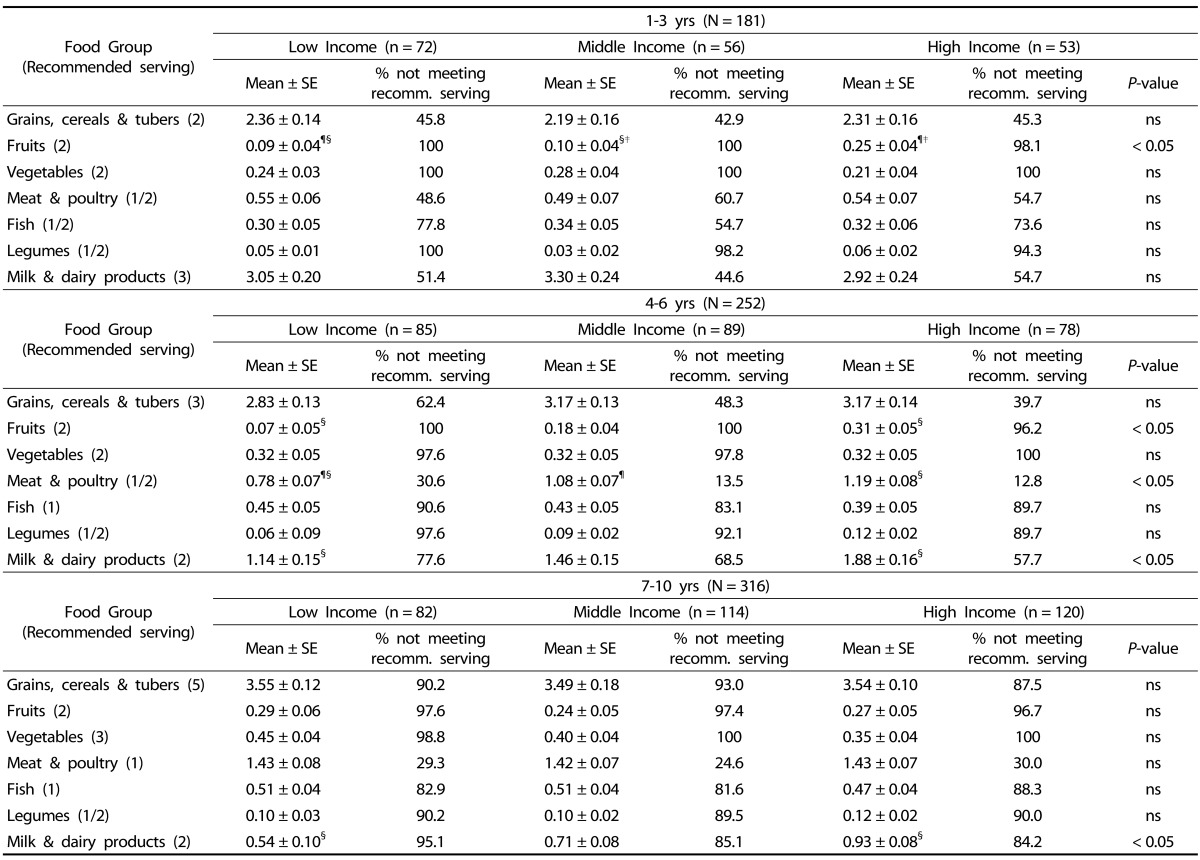
Table 5. Food group intakes of children (1-10 years old) by income level†.

¶,§,‡Same symbol indicates significant difference between groups
†Model adjusted for gender, ethnicity and BMI

¶,§,‡Same symbol indicates significant difference between groups
†Model adjusted for gender, ethnicity and BMI