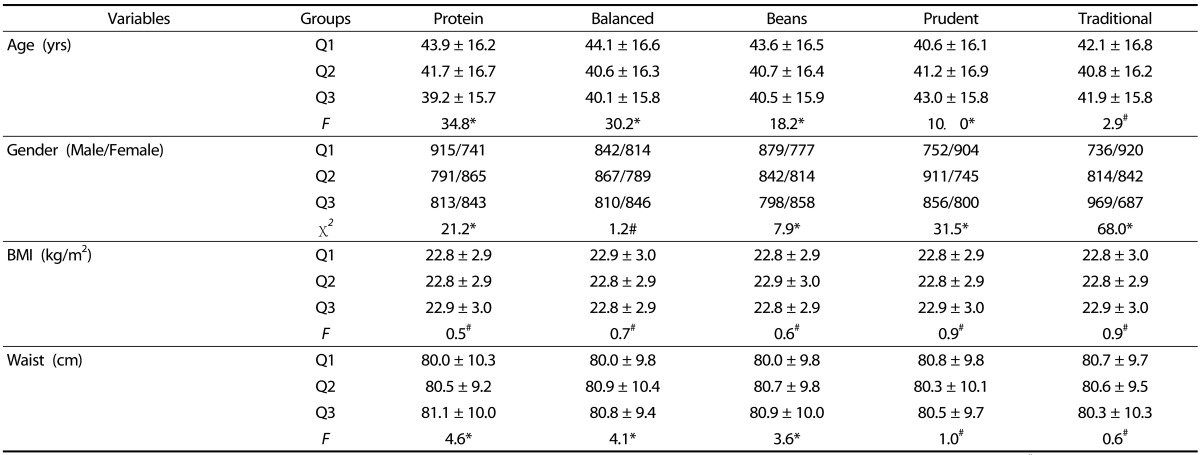
Table 3. Demography and body indices by dietary pattern.

Each factor is divided into Q1 (low percentile), Q2 (middle percentile), Q3 (high percentile) by score. N = 1656 in Q1, or Q2, or Q3. *P < 0.05, #P > 0.05

Each factor is divided into Q1 (low percentile), Q2 (middle percentile), Q3 (high percentile) by score. N = 1656 in Q1, or Q2, or Q3. *P < 0.05, #P > 0.05