
Table 1. Description of the total sample and sub-sample of elderly Poles 65 + years.
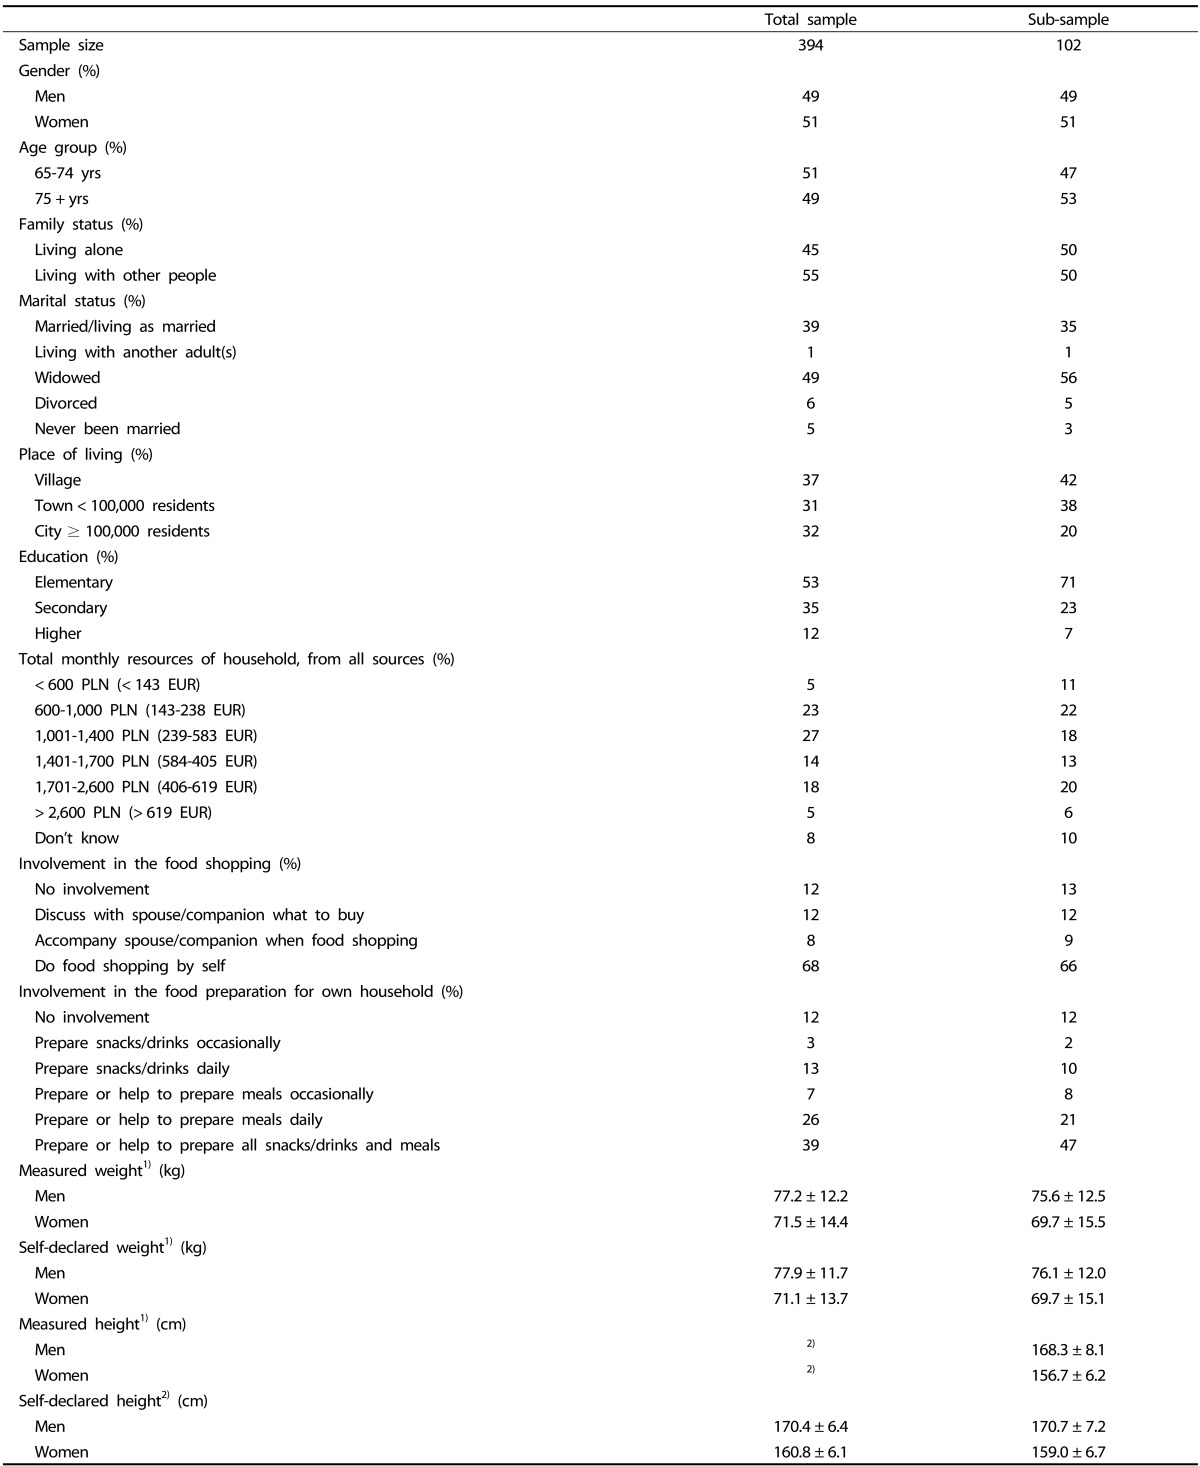
All the values were not significantly different in the total sample and sub-sample.
1)Mean ± standard deviation. 2)Height was measured in sub-sample only (in two provinces).