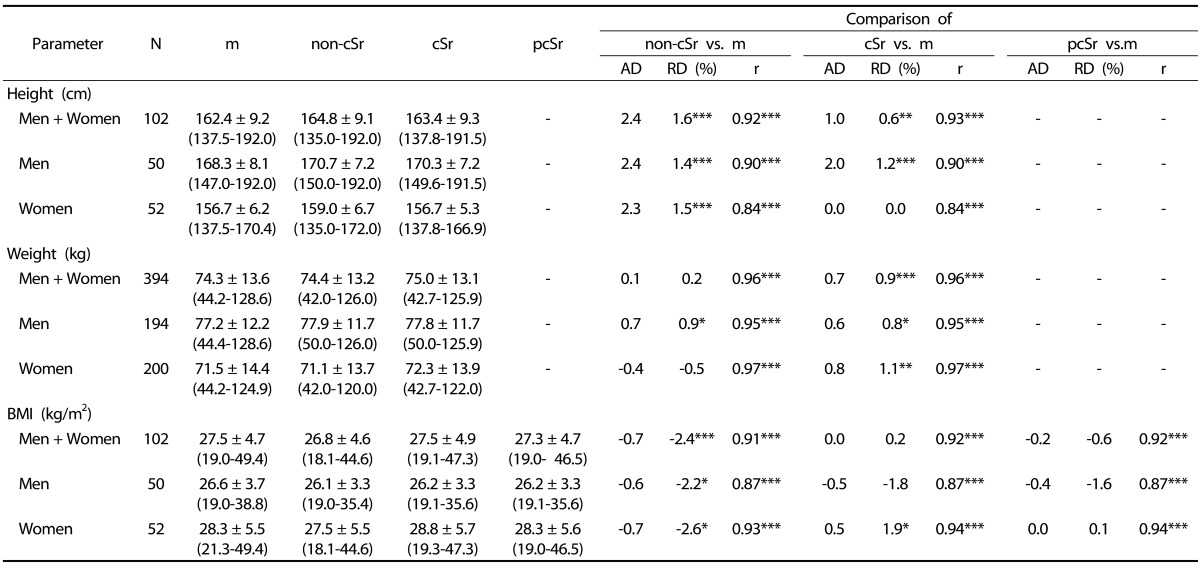
Table 2. Comparison of measured (m) and self-reported estimates before correction (non-cSr) or corrected self-reported (cSr), or partly-corrected self-reported (pcSr) of weight, height and BMI (mean ± standard deviation).

N-sample size.
AD-absolute difference.
RD-relative difference.
r-correlation coefficient.
( ) Minimum-maximum range is given in brackets.
Significance of differences at: *P < 0.05; **P < 0.01; ***P < 0.001.
