
Table 4. Comparison of distribution of BMI calculated on the basis of the measured (mBMI) and self-reported estimates before correction (non-cSrBMI) or self-reported corrected (cSrBMI), or self-reported partly corrected (pcSrBMI) (% of the sub-sample).
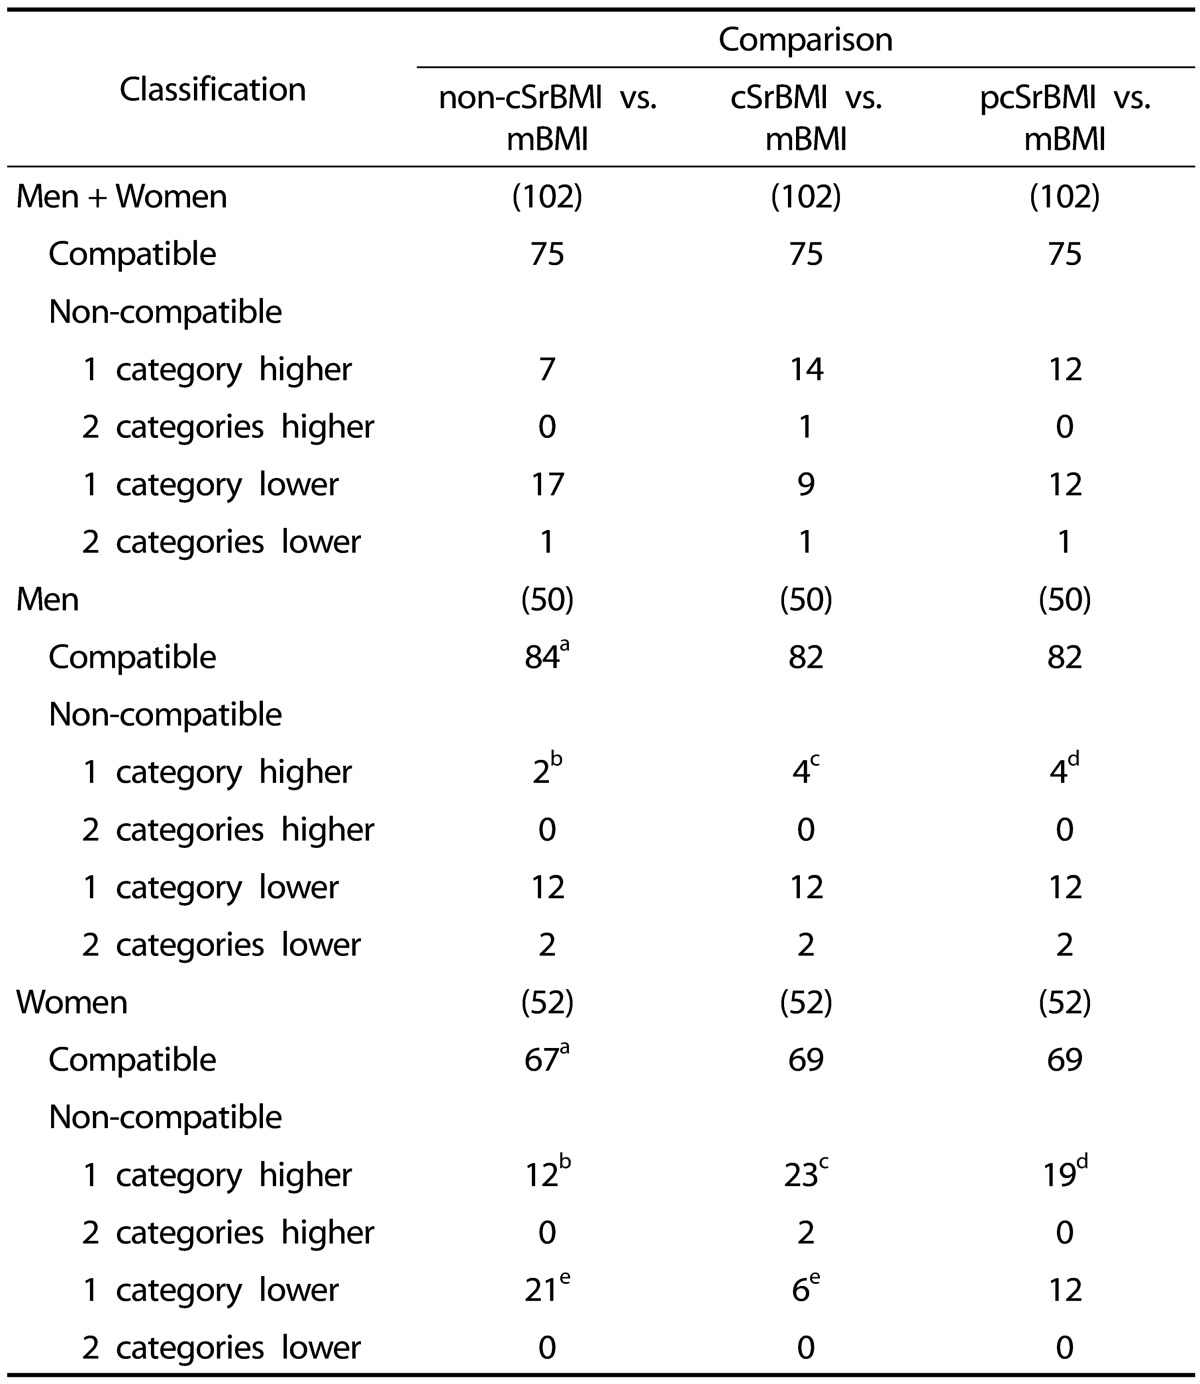
( ) Sample size is given in brackets.
a-a,...,e-ethe same letters are used to determine significant differences at P < 0.05.