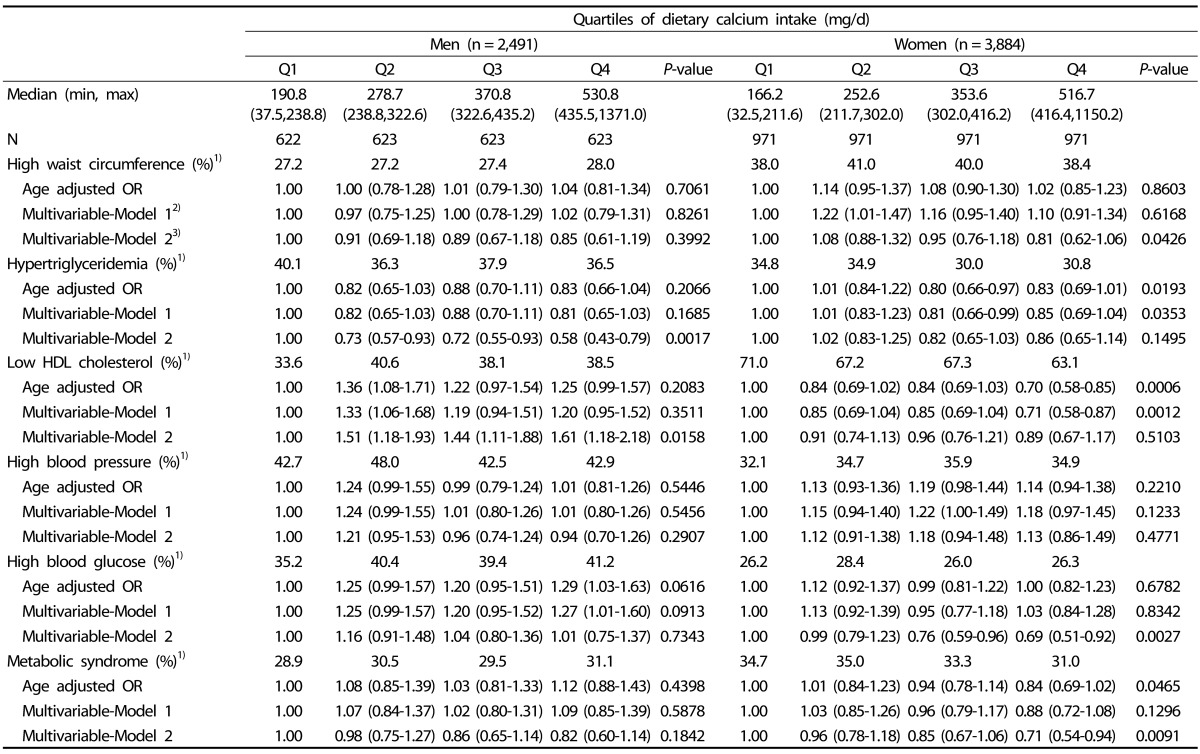
Table 3. ORs and 95% CI of metabolic syndrome and its components according to quartiles of dietary calcium intake from foods.

1)Age-adjusted prevalence
2)Multivariable-Model 1 was adjusted for age (yrs) and education (≥ High-school, yes/no) in men and age (yrs), education (≥ High-school, yes/no), farmer (yes/no), marital status (married or no), and exercise habits (≥ 22.5 MET-h/week) in women.
3)Multivariable-Model 2 was additionally adjusted for glycemic load and daily intake of fat, fiber, and sodium in men and glycemic load, and daily intake of fat, fiber, sodium and energy in women.
