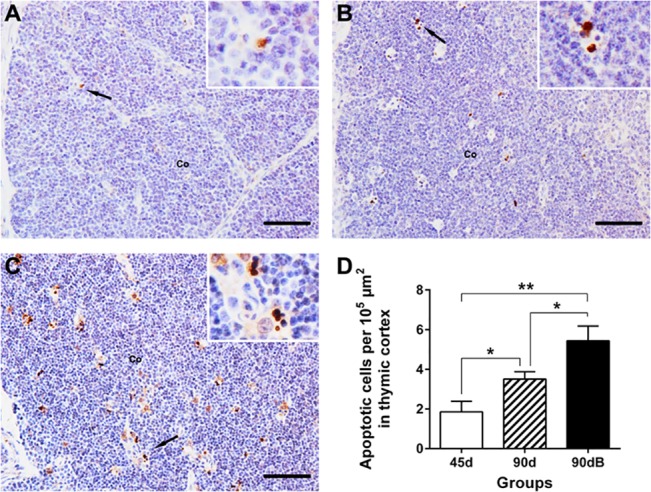
Fig 2. Changes of the apoptotic cell numbers in ostrich thymic cortex from different groups using anti-ssDNA mAb.

(A) in group 45d; (B) in group 90d; (C) in 90dB. Co, cortex. Bars, 50 μm. (D) Statistic analysis of numbers of apoptotic cells per 105 μm in thymus cortex. Data are representative of at least five tissue sections per ostrich (n = 3 per group). *p < 0.10, **p < 0.05.
