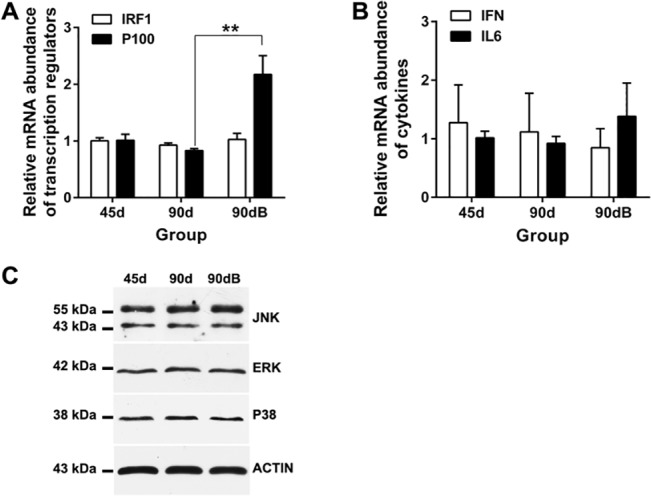
Fig 9. Expression profiles of ostrich TLRs’ downstream products in thymus from different groups.

(A) qRT-PCR analysis of IRF1 and p100 in ostrich thymus. (B) qRT-PCR analysis of IFN and IL-6 in ostrich thymus. **p < 0.05. (C) Western blotting analysis of JNK, ERK and p38 protein in ostrich thymus.
