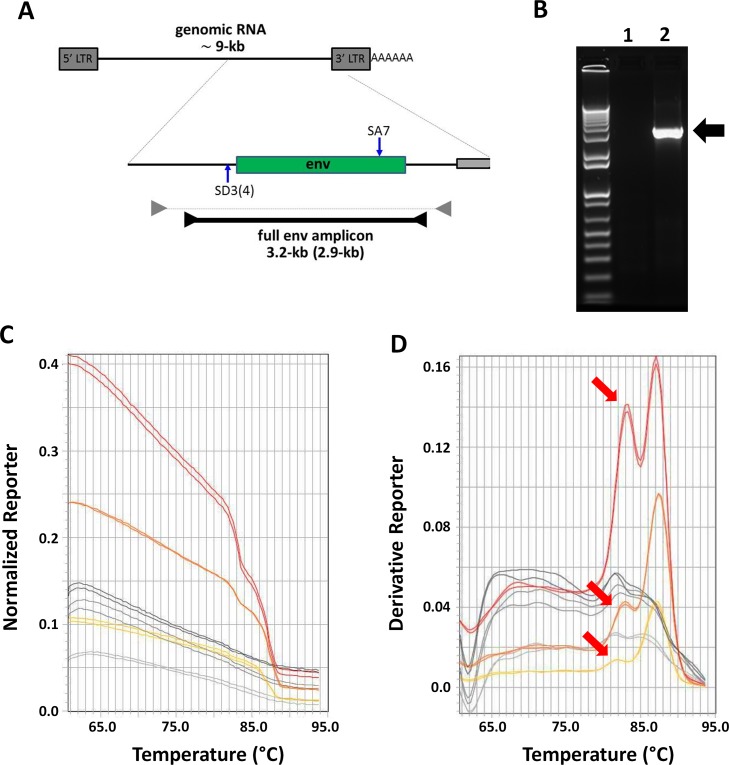
Fig 1. SYBR Green melting profile of the 3.2-kb SIV env SGA-amplicon.
(A) Schematic representation of SIV/HIV full env SGA amplicon. The SIV/HIV genomic RNA (top) with a blow-up of env region and the SGA amplicon (bottom) are shown. The relevant splice donor (SD3 for SIV, SD4 for HIV) and splice acceptor (SA7) sites are indicated. The primer pairs used in the first and second run of SGA PCR are represented by grey and black arrowheads respectively. The resulting full env amplicon (3.2-kb for SIV and 2.9-kb for HIV) used for sequencing and phylogenetic analysis is represented. When different from SIV, information relative to HIV is given in parentheses. (B) Gel electrophoresis analysis of the 3.2-kb SIV env SGA-amplicon. 1.2 μl of negative (lane 1) and positive (lane 2) SIV SGA-nested PCR reactions were loaded on a 1.2% agarose gel and stained with fast red to detect the 3.2-kb amplicon (arrow). (C, D) SYBR Green melting analysis of SIV SGA-PCR reactions. 1.2 μl of positive and negative SGA PCR reaction were added to melting reaction mixture containing increasing amounts of SYBR Green and melting run was performed. The resulting melting curves are presented in C and their corresponding melting peaks in D. The shoulder on the lower temperature side is indicated with a red arrow. Yellow, orange and red melting curves/peaks: melting profile of positive SGA reactions with 1, 2 and 4 μl SYBR Green respectively. Light grey, dark grey and Black melting curves/peaks: melting profile of negative reactions with 1, 2 and 4 μl SYBR Green respectively.

