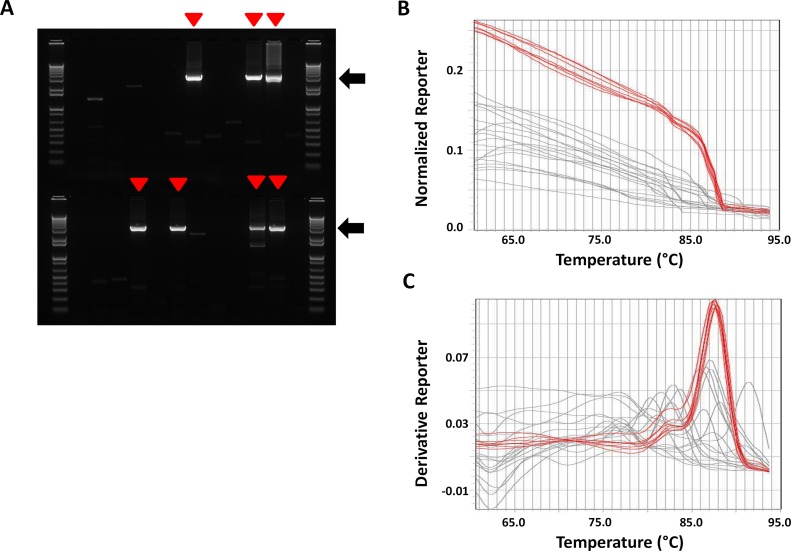
Fig 2. SYBR Green melt profiling of SIV SGA reactions originated from blood plasma sample.
RNA was extracted from the blood plasma of an SIV infected macaque and used for cDNA synthesis. 24 SIV SGA PCR reactions were performed starting from the RT reaction using a working dilution of 1/33. (A) Agarose gel analysis of 24 SGA reactions. 1.2 μl of the 24 SGA reactions were loaded on 1.2% agarose gel. The positive reactions containing the 3.2-kb env amplicon (black arrow) are indicated with a red arrowhead. (B, C) SYBR Green melting analysis of the 24 SGA reactions. Melting reactions were performed using 1.2 μl of the SGA reactions shown in A and 2 μl of SYBR Green in a total volume of 8 μl. The graphs corresponding to the melting curves and the melting peaks are given in B and C respectively. The red curves are corresponding to the 5 positive reactions indicated in A.

