
Fig 4. Forest plots of specimen weight using a random-effect model.
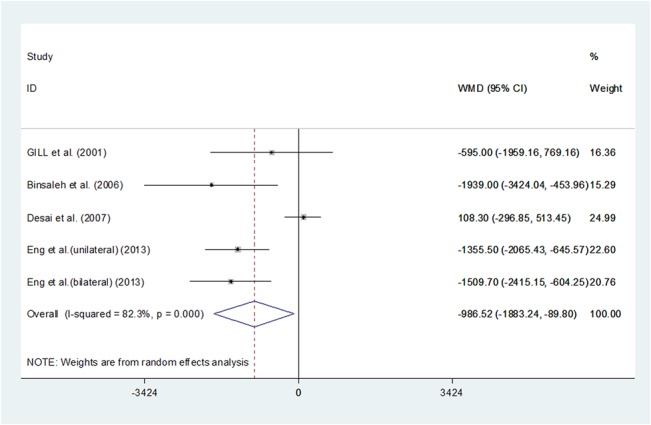
Squares indicate study-specific risk estimates (size of the square reflects the study-specific statistical weight, i.e., the inverse of the variance); horizontal lines indicate 95% confidence intervals (CIs); diamonds indicate summary risk estimate with its corresponding 95% confidence interval.