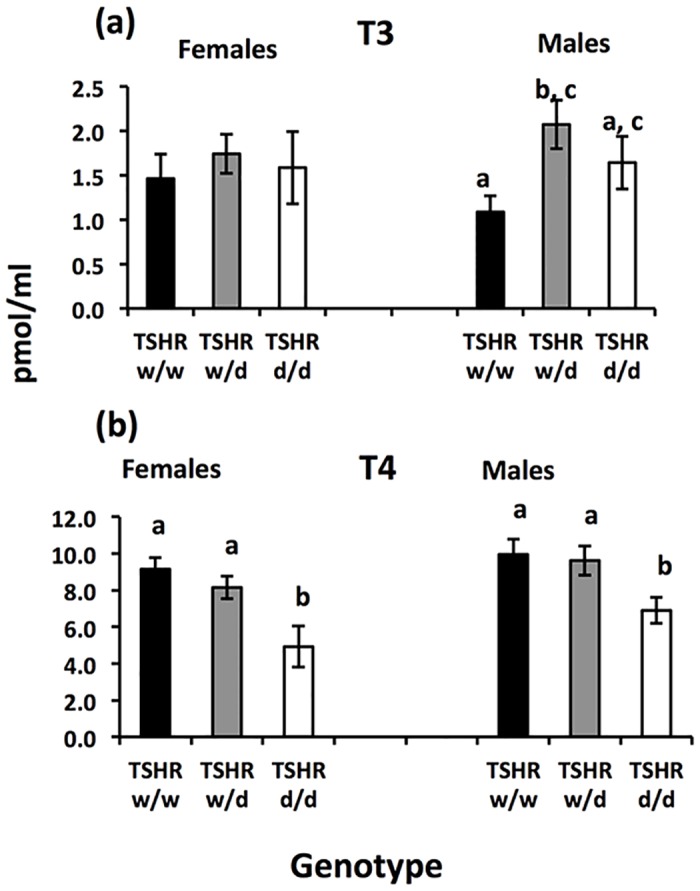
Fig 4. Average plasma concentration (±SEM) for each genotype and sex of the TSHR chickens.

(a) Plasma T3 concentration (b) Plasma T4 concentration. Post-hoc analyses, T3 males and T4 females and males: bars designated with different letters differ significantly at P<0.05.
