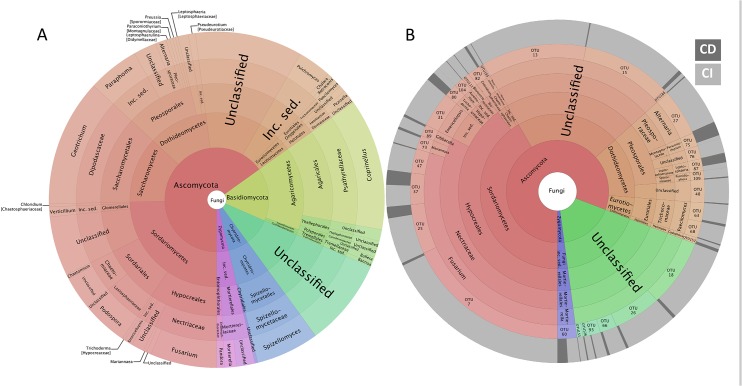
Fig 3. Krona charts showing the taxonomic identification and relative abundance of the most abundant fungal OTUs recorded in CI datasets (A) and shared OTUs between CI and CD datasets (B).
The proportion of sequences from the CI (light grey) or CD (dark grey) datasets for each shared OTU is shown in the outer ring.

