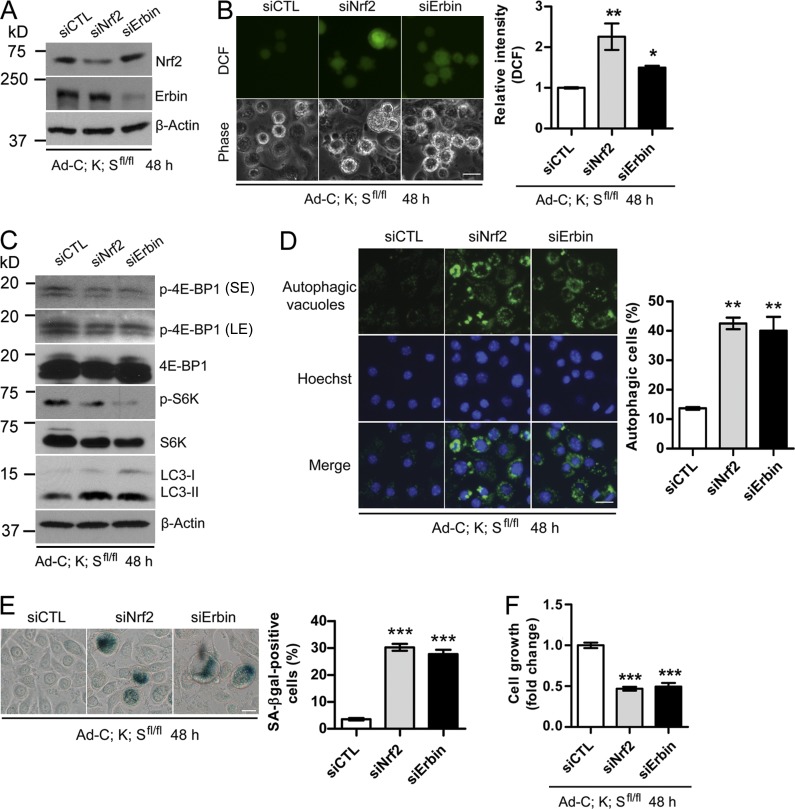
Figure 7.
Silencing of Nrf2 or Erbin rescues the phenotypes induced by Sag deletion. (A–C) Ad-C;K;Sfl/fl keratinocytes were infected with siRNA targeting either Nrf2 or Erbin, followed by IB (A and C), or ROS measurement by DCFHDA staining and photographed with a fluorescence microscope (B, left) and quantified with a flow cytometer (B, right; n = 2). (D–F) Autophagy was detected using the Cyto-ID autophagy detection kit (D), senescence using X-gal staining (E), and cell proliferation by ATPlite assay kit (F; n = 5). The data shown are from a single representative experiment out of three repeats. For the experiment shown, a total of 300 cells were counted in each group (D and E). Error bars indicate the SEM. LE, long exposure; SE, short exposure. *, P < 0.05; **, P < 0.01; ***, P < 0.001. Bars, 20 µm.

