Figure 5.
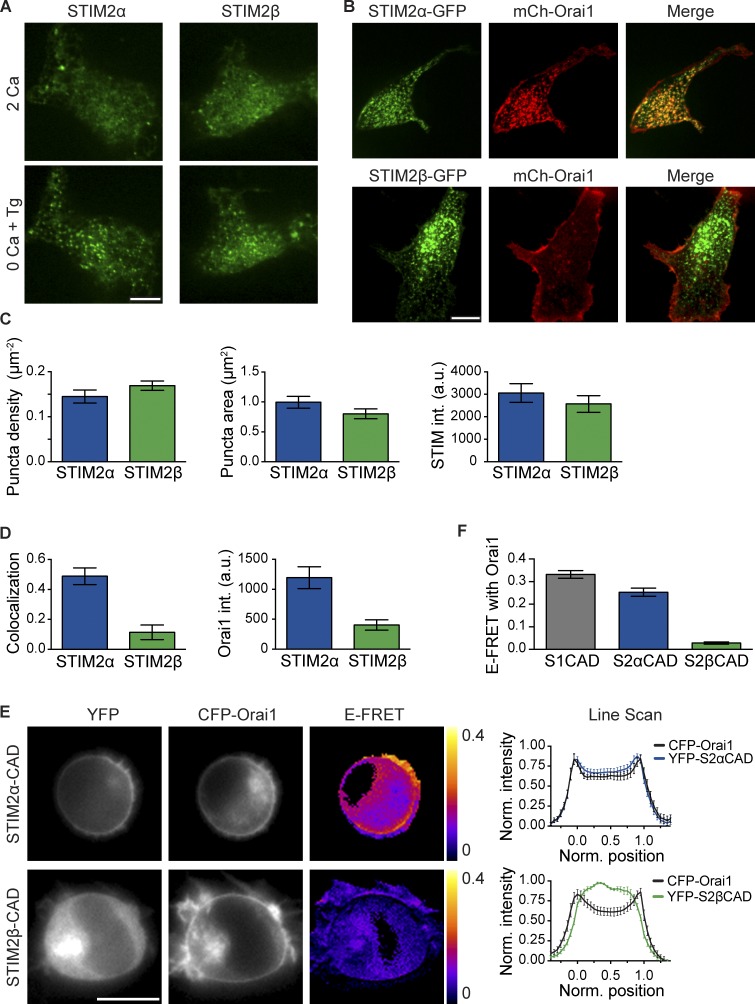
STIM2β responds normally to store depletion but shows weakened Orai1 binding. (A) STIM2β accumulates at ER–PM junctions upon store depletion. Fluorescent puncta in two representative HEK293 cells expressing either mCherry (mCh)-STIM2α or -STIM2β are shown before (top) and after (bottom) store depletion with 1 µM Tg. (B) STIM2α-GFP, but not STIM2β-GFP, recruits mCherry-Orai1 into puncta after store depletion with Tg. (C) STIM2β forms puncta to a similar extent as STIM2α. Density (left), area (middle), and intensity (right) of puncta in store-depleted cells were quantified from experiments similar to B (n > 15 cells for each bar, P > 0.1 for each comparison, two-tailed t test). (D) Compared with STIM2α, STIM2β shows lower colocalization with Orai1 (left, measured as Pearson correlation; P < 0.0001, two-tailed t test) and elicits a lower Orai1 intensity (int.) in puncta (right, P = 0.0002, two-tailed t test; n > 15 cells for each bar). Data were compiled from experiments similar to B. (E) Binding of STIM2β-CAD to Orai1 is disrupted. FRET in HEK293 cells transfected with CFP-Orai1 and YFP-tagged STIM2α- or STIM2β-CAD. Unlike STIM2α-CAD (top), STIM2β-CAD (bottom) shows neither membrane recruitment nor significant FRET, indicating marginal binding to Orai1. Averaged line scans across cells (right) show high PM colocalization of Orai1 and STIM2α-CAD (n = 8 cells) but poor PM colocalization for Orai1 and STIM2β-CAD (n = 7 cells). Positions 0 and 1 represent the opposite edges of each cell. (F) Comparison of mean E-FRET between Orai1 and STIM1-, STIM2α-, or STIM2β-CAD from experiments like those in E (n > 18 cells for each bar, P < 0.0001, Mann–Whitney test). Error bars show means ± SEM. a.u., arbitrary unit. Bars: (A and B) 10 µm; (E) 5 µm.

