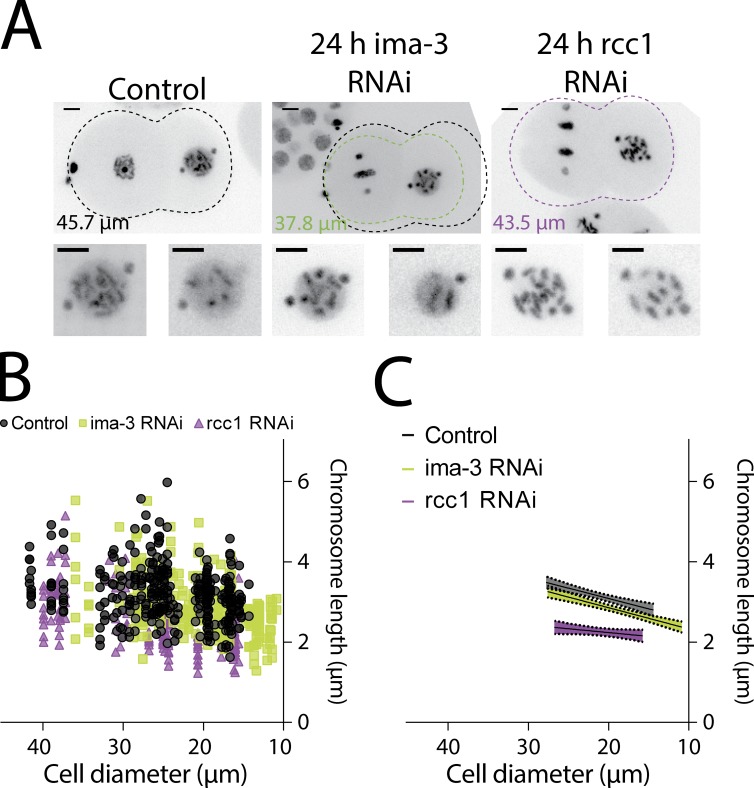
Figure 2.
Chromosome length scales to cell size, not developmental program. (A) Representative still images of time-lapse movies from TH32 after control, IMA-3, and RCC1 depletion at the 2-cell stage. Shown is the outline of the embryo and size of the depicted embryo: black, control; green, IMA-3 RNAi; and purple, RCC1 RNAi. The control outline is overlaid on ima-3 to illustrate differences in size. Bars, 5 µm. (B) Chromosome length correlated to cell size in control and IMA-3– and RCC1-depleted embryos. (C) Graph representing the linear regression of cell size versus chromosome length. The shadows represent the 95% confidence interval. In B, control measurements are duplicated from Fig. 1 to compare the other conditions. IMA-3 RNAi, n = 287 chromosomes; RCC1 RNAi, n = 207 chromosomes.

