Figure 3.
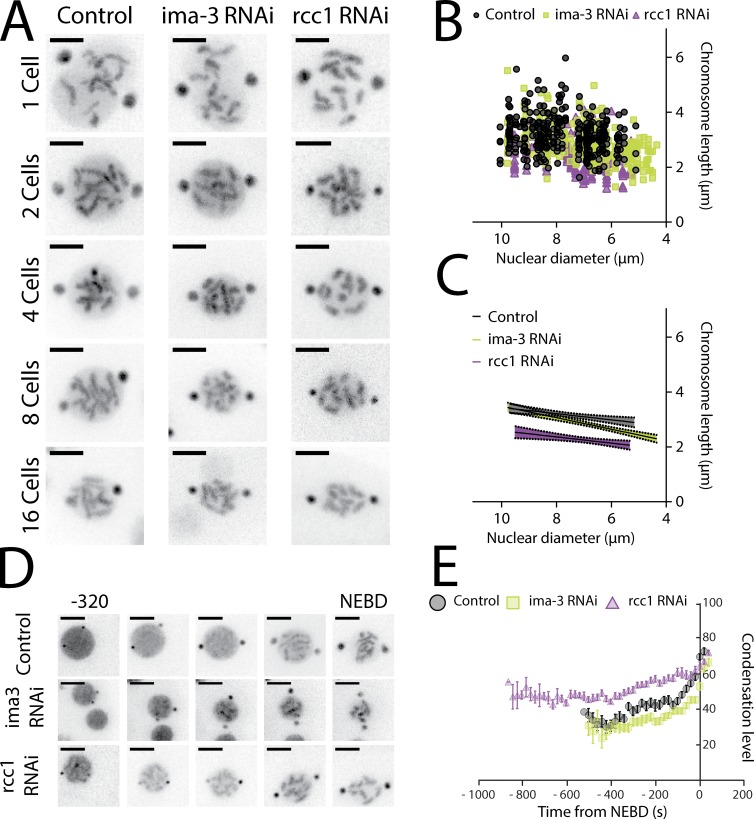
When uncoupling nuclear to cell size, chromosome length scales to nuclear size. (A) Representative still images from time-lapse movies of nuclei from TH32 embryos after RNAi depletion of control, IMA-3, and RCC1 at the 1- to 16-cell stage. (B) Chromosome length correlated to nuclear size in control, IMA-3, and RCC1 RNAi. (C) Graph representing the linear regression of nuclear size versus chromosome length. The shadows represent the 95% confidence interval. (D) Representative still images from time-lapse movies of TH32 at the 8-cell stage from −320 s to NEBD. (A and D) Bars, 5 µm. (E) Kinetic plot of the condensation parameter. Error bars are standard error of the mean. (For more details on the assay, see Materials and methods and refer to Maddox et al., 2006.) Control, n = 39; IMA-3 RNAi, n = 45; and RCC1 RNAi, n = 29. Images are 40-s intervals.

