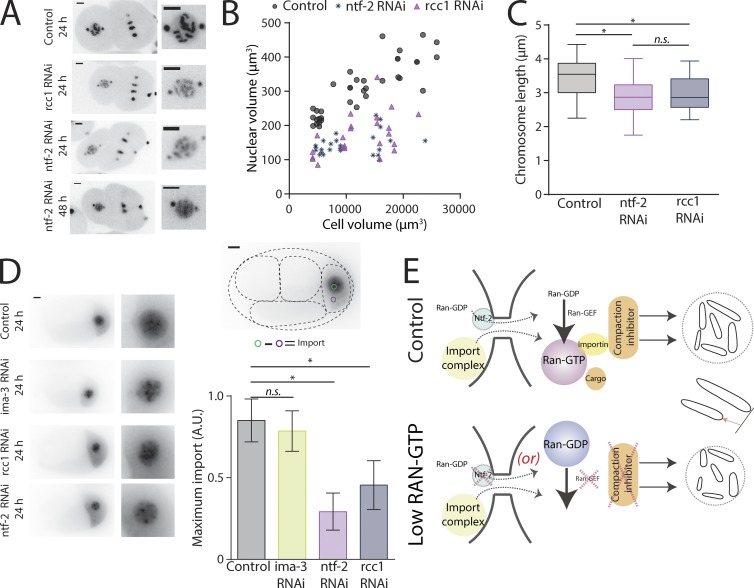
Figure 4.
Ran pathway members regulate chromosome and nuclear size through limited nuclear import. (A) Representative still images from time-lapse movies of nuclei from TH32 embryos after RNAi depletion of control, RCC1, and NTF2 at the 2-cell stage. (B) Nuclear volume correlated to cell volume (in µm3) in control, RCC1, and NTF2 RNAi embryos. See Table S3 for linear regression information. Control, n = 37; RCC1 RNAi, n = 23; and NTF2 RNAi, n = 30. (C) Boxplot of chromosome length at the 2-cell stage. The box represents the 25th and 75th percentiles of the distribution. The line in the middle of the box is the median. The whiskers are the smallest and largest values of the distribution. (D) Representative still images from time-lapse movies of PIE-1::GFP’s nuclear import in P2 cells and mean maximum nuclear import of Pie-1::GFP expressed as a ratio of control’s maximum import. Error bars are standard deviation. (A and D) Bars, 5 µm. (E) Chromosome length scaling model based on a differential level of Ran-GTP in small (low concentration) versus larger cells (high concentration). The low concentration of Ran-GTP schematic represents either (a) depletion of NTF-2, which prevents nuclear import of Ran-GDP, or (b) depletion of the Ran-GEF, which prevents exchange of GDP to GTP on Ran. n.s., not significant; *, P ≤ 0.05.

