Figure 1.
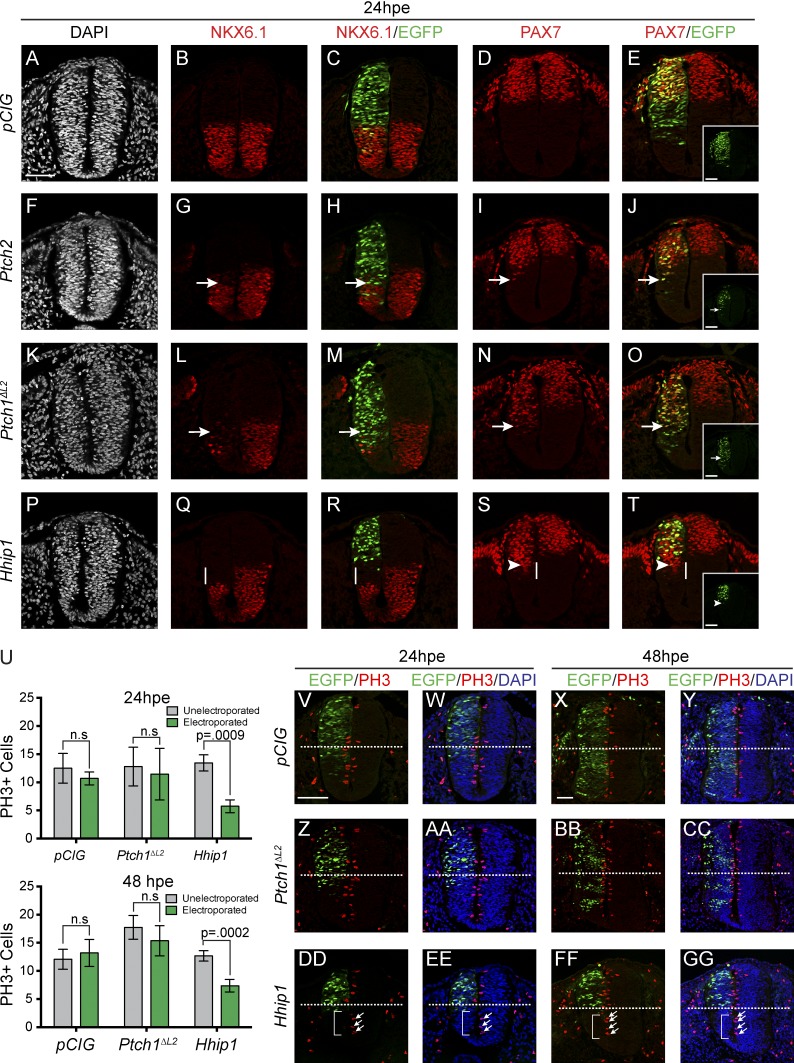
Ectopic HHIP1 expression non–cell-autonomously inhibits neural progenitor patterning and proliferation. (A–T and V–GG) Embryonic chicken neural tubes electroporated at Hamburger-Hamilton stage 11–13 with pCIG (A–E and V–Y), mPtch2-pCIG (F–J), mPtch1ΔL2-pCIG (K–O and Z–CC), or mHhip1-pCIG (P–T and DD–GG) and dissected 24 h postelectroporation (hpe; A–T, V, W, Z, AA, DD, and EE) or 48 hpe (X, Y, BB, CC, FF, and GG). Transverse sections from the wing axial level were stained with antibodies directed against NKX6.1 (B, C, G, H, L, M, Q, and R), PAX7 (D, E, I, J, N, O, S, and T), and phospho–histone H3 (PH3; V–GG). Nuclei are stained with DAPI (gray [A, F, K, and P] or blue [W, Y, AA, CC, EE, and GG]). (C, E, H, J, M, O, R, T, and V–GG) Nuclear EGFP expression labels electroporated cells. Arrows indicate repression of NKX6.1 expression (G, H, L, and M) or ectopic PAX7 expression (I, J, N, and O). (E, J, O, and T) Insets show individual green channels. White lines highlight non–cell-autonomous NKX6.1 repression (Q and R) and ectopic PAX7 expression (S and T). (S and T) Arrowheads demarcate the ventral most electroporated cell. (V–GG) Dotted lines bisect the neural tube into dorsal and ventral halves. (DD–GG) Arrows highlight PH3+ cells on the unelectroporated side of the neural tube, whereas brackets denote the lack of PH3+ cells resulting from HHIP1 expression. (U) Quantitation of total PH3+ cells. Data are presented as mean ± SEM. P-values determined by two-tailed Student’s t test. Bars, 50 µm.

