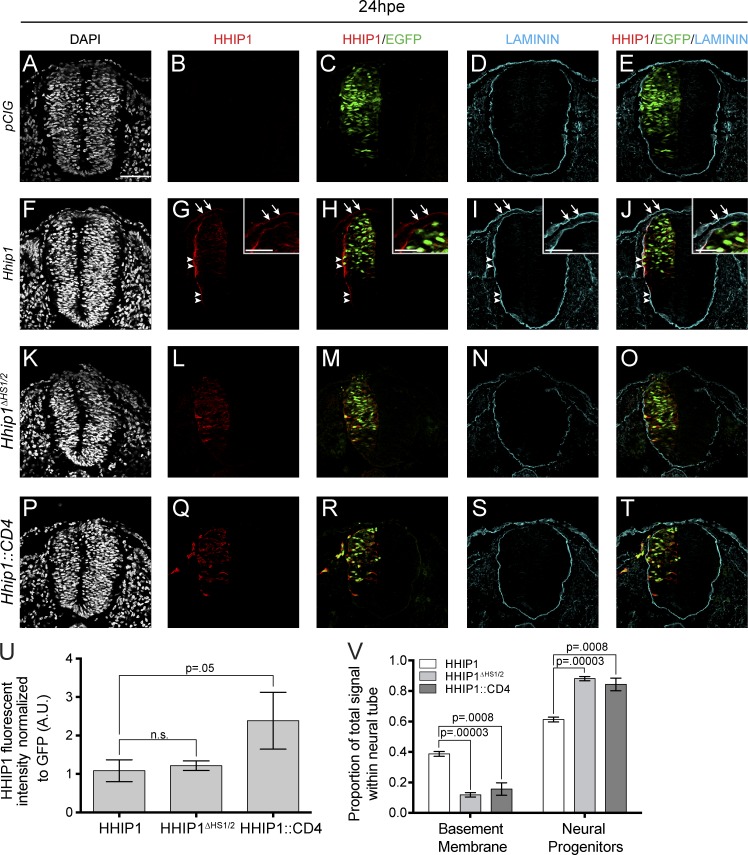
Figure 8.
HS binding is required to localize HHIP1 to the neuroepithelial BM. (A–T) Immunofluorescent detection of HHIP1 (B, C, E, G, H, J, L, M, O, Q, R, and T) and Laminin (D, E, I, J, N, O, S, and T) in embryos electroporated with pCIG (A–E), mHhip1-pCIG (F–J), mHhip1ΔHS1/2-pCIG (K–O), and mHhip1::CD4-pCIG (P–T) and isolated 24 hpe. (A, F, K, and P) DAPI stains nuclei (gray). (C, E, H, J, M, O, R, and T) Nuclear EGFP labels electroporated cells. (G–J) Note HHIP1 colocalization with Laminin in the neural tube (arrowheads) and surface ectoderm (arrows, insets). (U) Quantitation of HHIP1 fluorescent intensity normalized to GFP expression. A.U., arbitrary unit. (V) Data in U binned into signal measured within the BM or neural progenitors. Data are presented as mean ± SEM. P-values determined by Student’s two-tailed t test. Bars: (A) 50 µm; (G, H, I, and J, insets) 25 µm.

