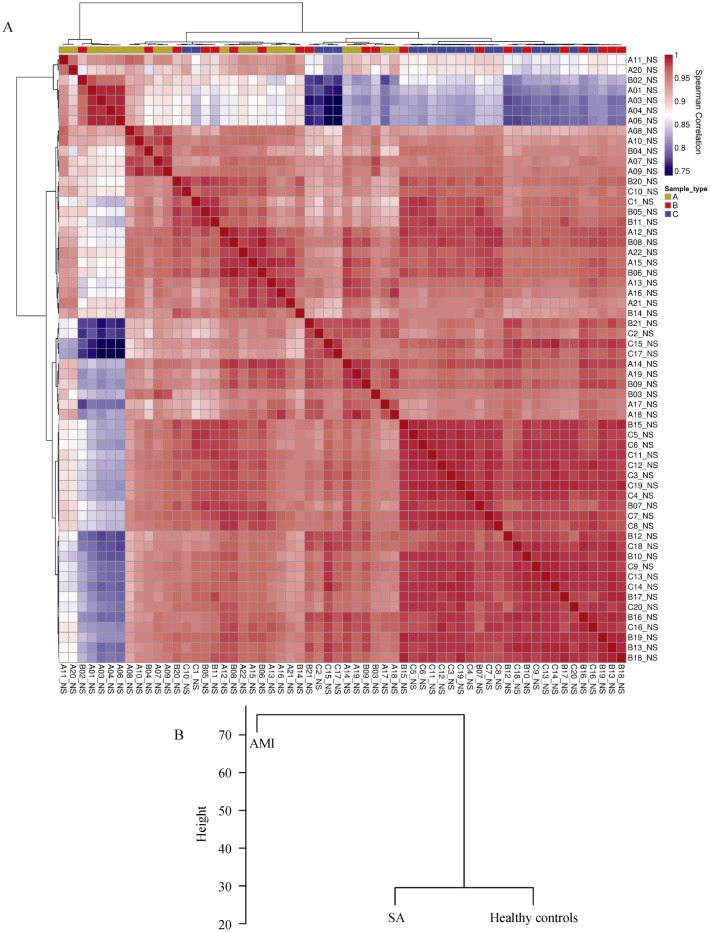
Figure 1. Sample clustering for three groups, including AMI, SA and 20 healthy volunteers.
(A): Dendrograms at the top and left of correlation matrix were hierarchical clustering of samples; (B): condition cluster based on average signal intensity of each probe. The color of each cell symbolized the Spearman correlation of each sample pairs, from high (red) to low (blue). The color band above the correlation matrix is the symbols of sample condition: AMI (gold), SA (red), and healthy control (blue). AMI: acute myocardial infarction; SA: stable angina.

