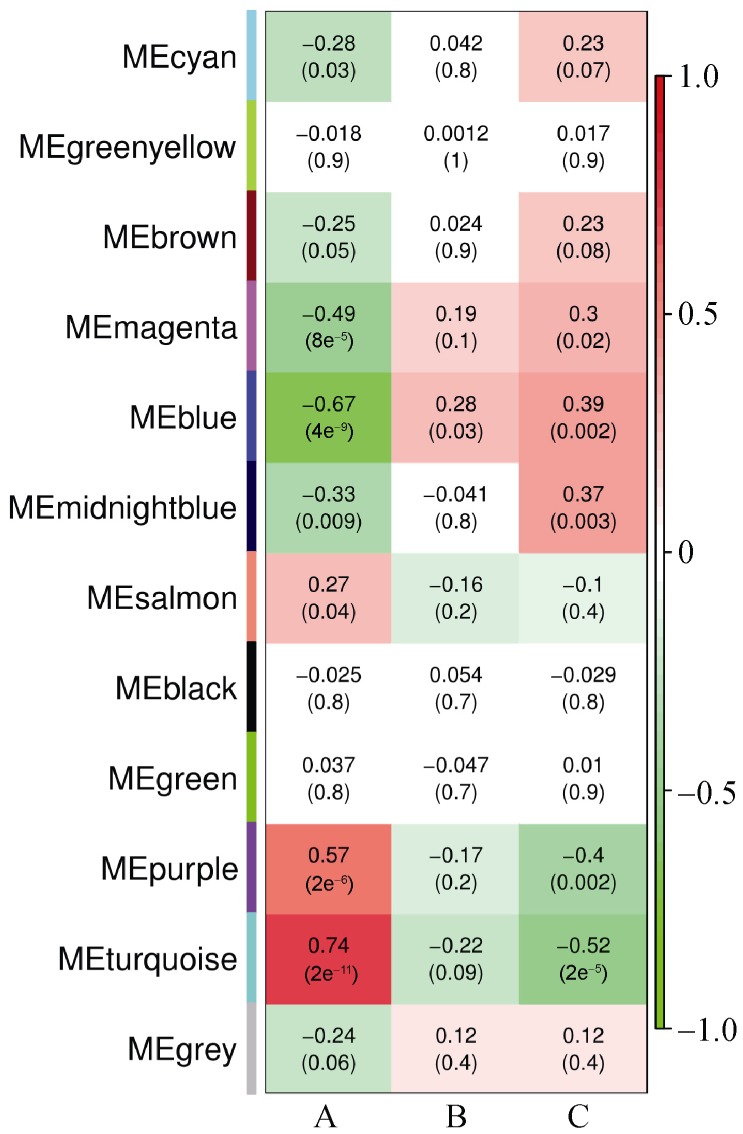
Figure 3. Heatmap of correlations and corresponding P-values between modules and conditions.

Each module is represented by its module eigengene. Number in each squar represents correlation (and P-value of correlation) between module and condition. The square color represents: positive correlation (red); negative correlation (green); or no correlation (white). Many modules reported modules (rows) are significantly (P < 0.05) positively-correlated (i.e., turquoise module) or negatively-correlated (i.e. blue module) with distinct conditions (columns).
