
Figure 2. Magnetic resonance imaging axial image of the mid-thigh in a patient with HFpEF and HC.
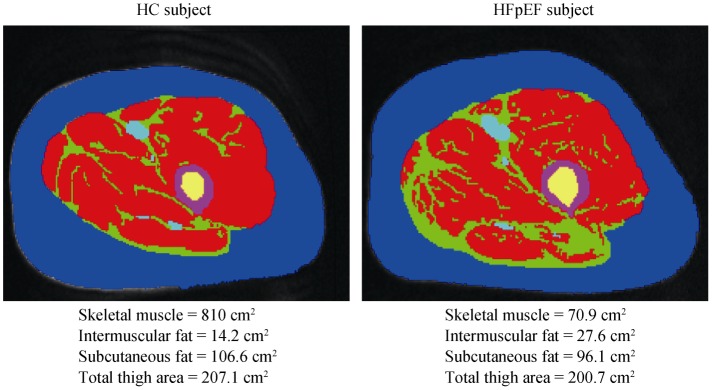
Red = skeletal muscle; green = IMF; blue = subcutaneous fat; purple = femoral cortex; yellow = femoral medulla. IMF (green) is substantially increased in the patient with HFpEF compared with the HC despite similar subcutaneous fat. HC: healthy controls; HFpEF: heart failure with preserved ejection fraction; IMF: intermuscular fat.