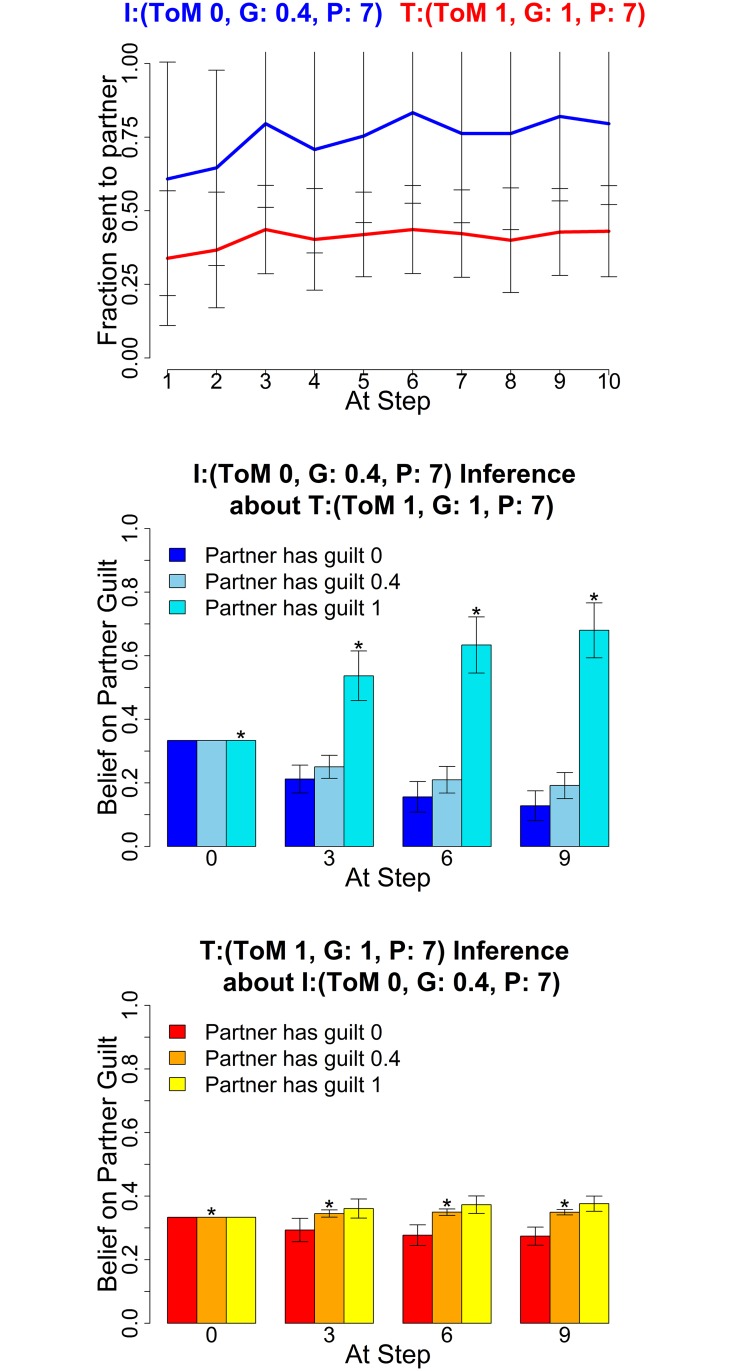
Fig 14. Driving up cooperation.
Average Exchanges (upper) and posteriors (mid and lower), Investor (0,0.4,7) and Trustee (1,1,7). The posterior distributions are shown for α = (0,0.4,1) at four stages in the game. Error bars are standard deviations. The asterisk denotes the true partner guilt value.

