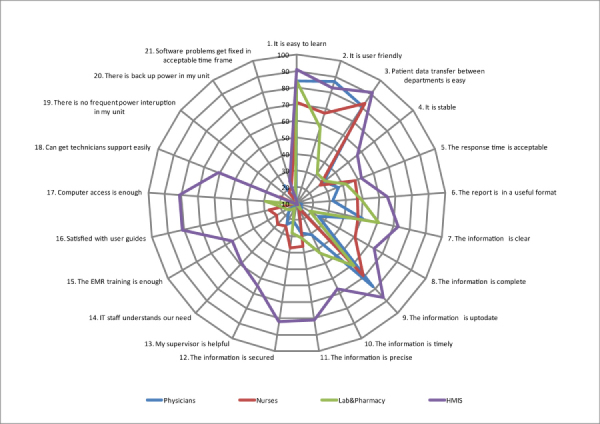
Figure 3.

Perceived system, information, and service quality of the study (n=309). The numbering on the label is to show in which category the criteria belong (1-5=System quality; 6-12=Information quality; 13-21=System quality). The main axis is the reported percentage. As shown in the figure, HMIS staff give more positive responses than phycisians and nurses .
