Figure 4.

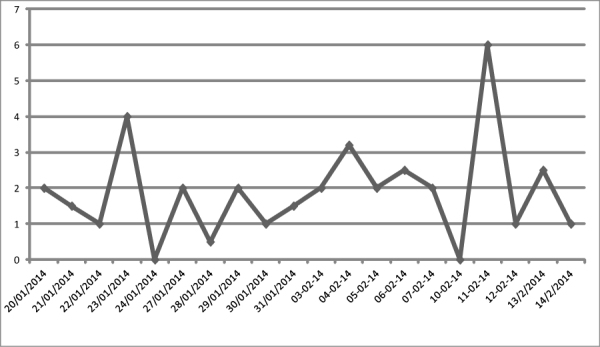
The average daily power interruption rate in the four hospitals of Addis Ababa (January-February, 2014). Fluctuations were measured during work hours (8 hours) and days.

The average daily power interruption rate in the four hospitals of Addis Ababa (January-February, 2014). Fluctuations were measured during work hours (8 hours) and days.