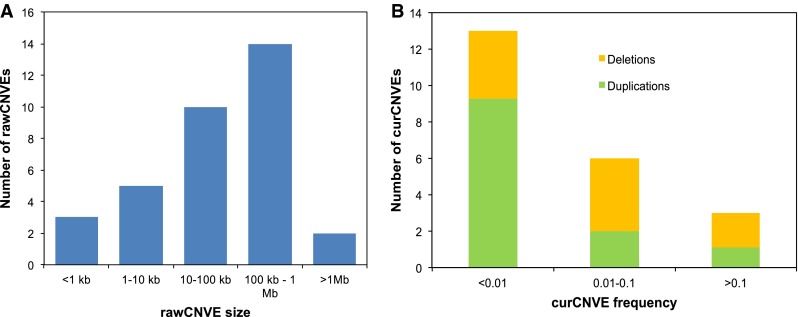
Fig. 3.

Size and frequency distribution of validated and likely CNVs in 238 individuals. a rawCNVE size distribution. b curCNVE frequency distribution; each frequency bar is coloured according to the proportion of duplications (green) and deletions (orange) among the total 381 curCNVE calls
