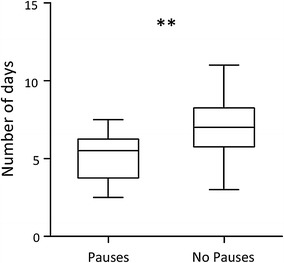
Fig. 2.

Number of days needed to reach the learning criterion. Discrimination between strings was made more quickly with pauses between the triplets of the strings. The boxplots show the median (horizontal line) and first and third quartile of the data, with whiskers extending to the minimum and maximum values. Asterisks indicate a significant difference between the groups
