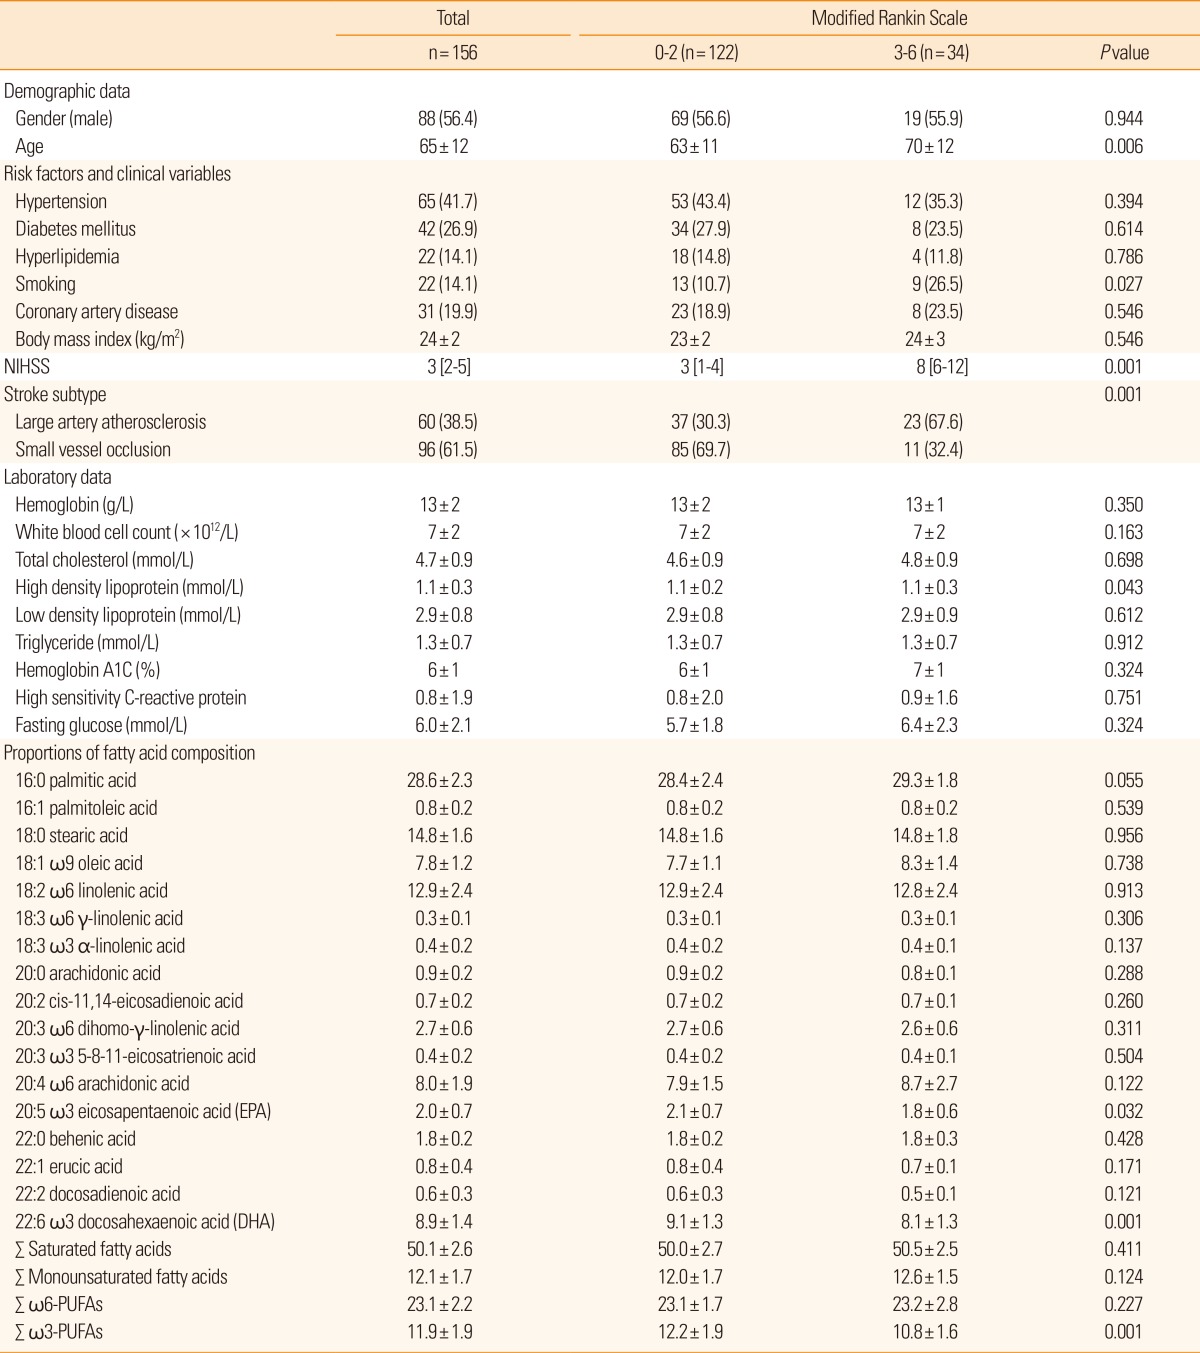
Table 1. Demographic data and comparison of clinical data according to functional outcome.

Values are reported as number (%), mean±standard deviation, or median [interquartile ranges].
NIHSS, National Institute of Health Stroke Scale score; PUFAs, polyunsaturated fatty acids.
